Hello @andreas-doehler
@r.sander,
So my monitoring server is “A” and the host in which elastic search is there and which is added in the monitoring server be “B”
monitoring check server as "A"
Host added in checkmk is "B"
I have added my local checkmk plugin in “B” host
/usr/lib/check_mk_agent/plugins/elasticsearch
At the end of the script as output I am giving
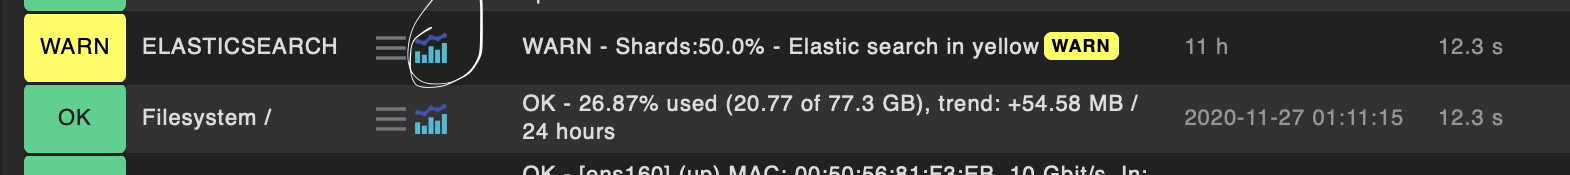
""echo “$status ELASTICSEARCH shards=$active_shards $msg”
where “shards” is my performance data name which is showing graph .
Now I need perf-o-meter for the same.
For this in the monitor server that is “A” ,we need to mention the metric ,definition ,perfometer info right
In “A” monitoring checkmk server
Under /local/share/check_mk/web/plugins/metrics/elasticsearch.py
I have added
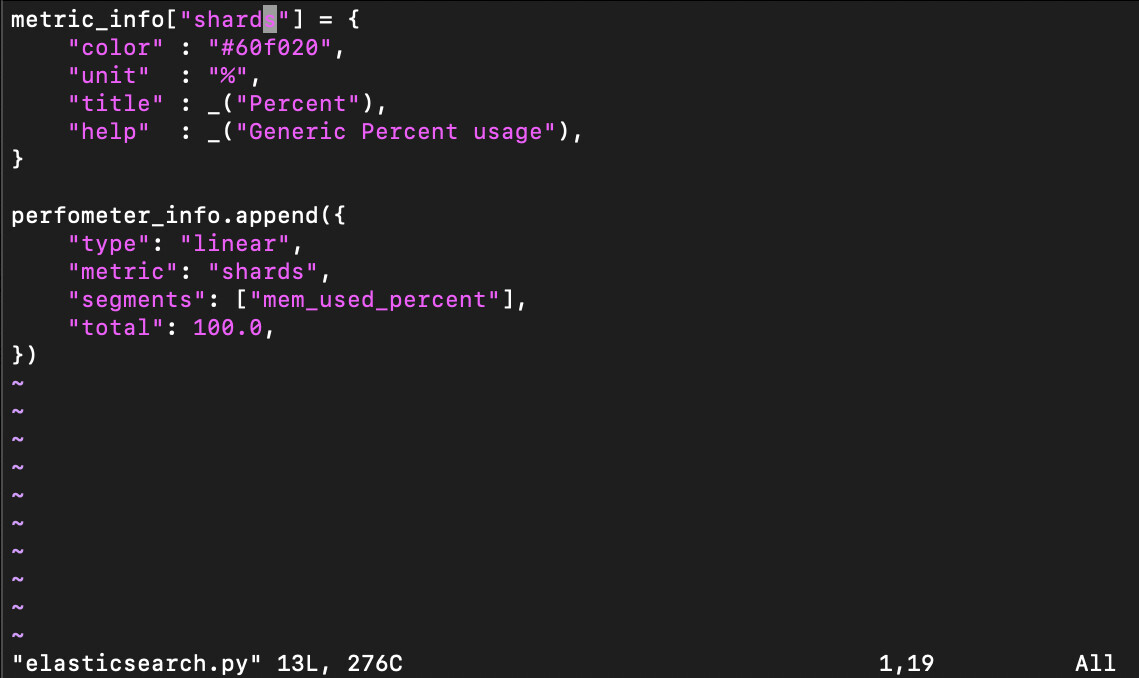
and when I refreshed nothing I am getting related to perf-o-meter in the checkmk server for host B in which elastic search plugin created
**Do we need to add anything further in the “/local/share/check_mk/web/plugins/metrics/elasticsearch.py” **
and where to mention like this check-mk_local perfometer like
"perfometers[“check_mk-local”] = perfometer_your_custom_template_name"
and def perfometer_check_mk_. for my this “shards” performance data name, so that we get our perf-o-meter for this local check plugin
Please please help me to figure out and how to proceed further
Thanks