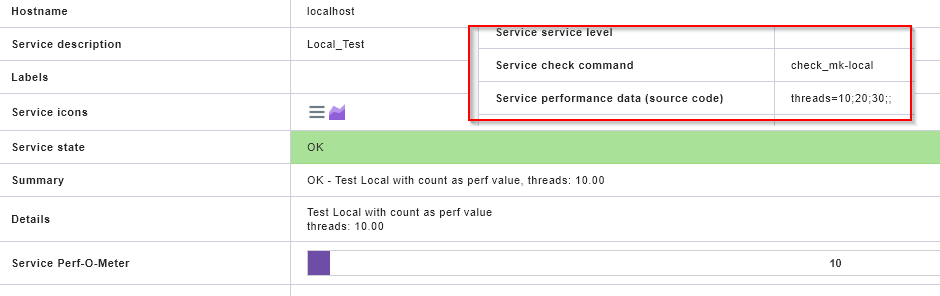
What you need is the performance data output from your local check.
If you use there well known descriptions then you get automatically a perf-o-meter.
As an example use “threads” as the name of your performance data and you will get the same perf-o-meter as for the Linux threads check.
case $node_status in
[gG][rR][eE][eE][nN])
status=0;
msg=“The nodes are up, the shards for each index are loaded and the replicas have been recovered on a separate nodes and active shards=$active_shards”;
;;
[yY][eE][lL][lL][oO][wW])
status=1;
msg=“Not all replicas have been recovered. If a node goes down, there can be data loss and active shards=$active_shards”;
;;
*)
status=2;
msg=“some primary data shards are missing. This means there data loss right now. This is bad but not disastrous as some nodes might still be rebooting.and active shards=$active_shards”;
;;
esac
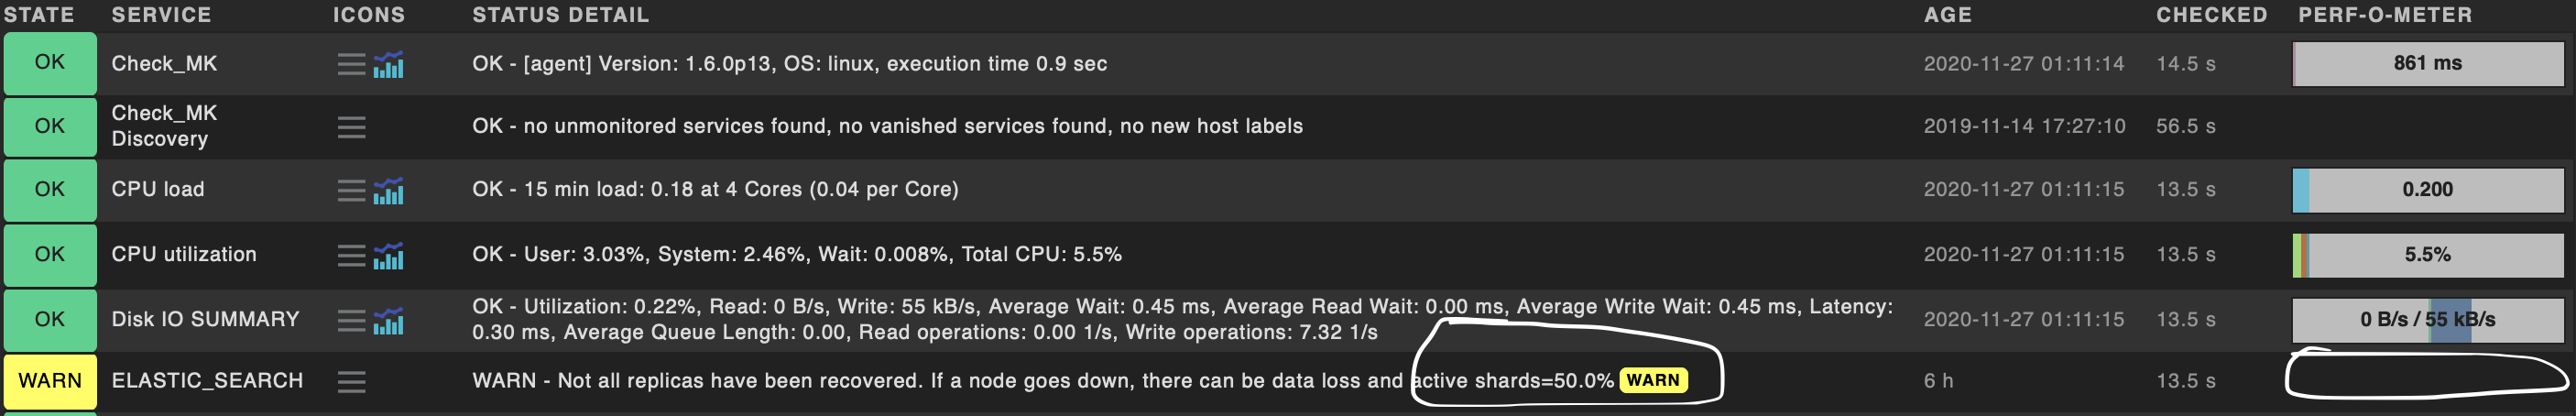
echo “$status ELASTIC_SEARCH - $msg”
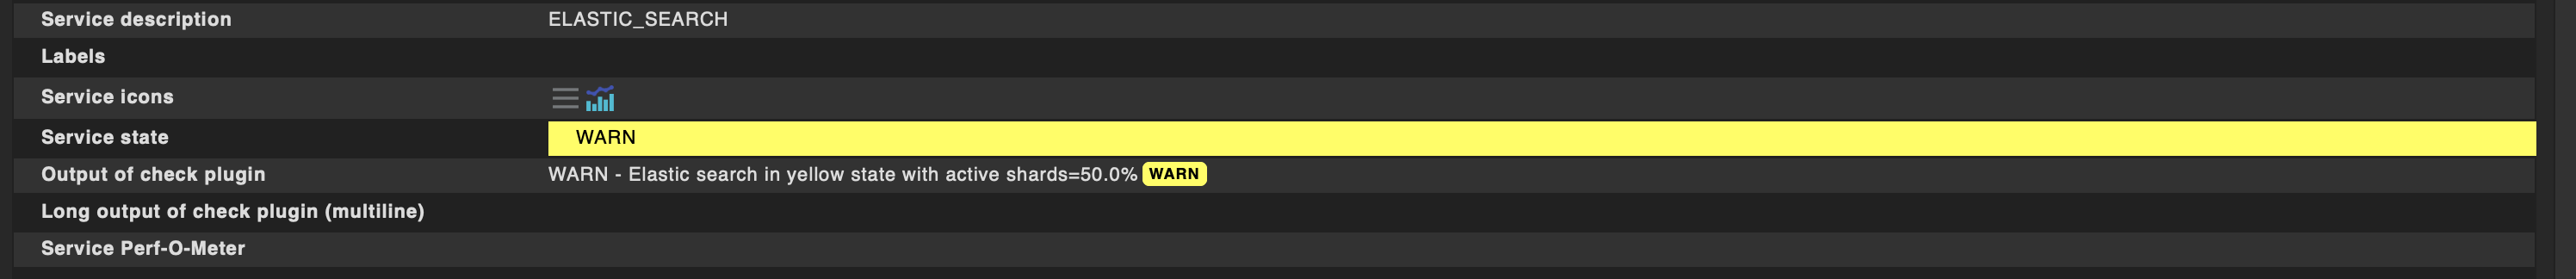
and below is the output that i am getting in checkmk that is Elastic search output in warn state
Your local check don’t generate performance data. Without performance data no graph or perf-o-meter.
Please read the documentation to this here Local checks
case $node_status in
[gG][rR][eE][eE][nN])
status=0;
msg=“Elastic search in $node_status state with active shards=$active_shards”;
;;
[yY][eE][lL][lL][oO][wW])
status=1;
msg=“Elastic search in $node_status state with active shards=$active_shards”;
;;
*)
status=2;
msg=“Elastic search in $node_status state with active shards=$active_shards”;
;;
esac
If you need some inspiration for your own definitions, you can look at the file
“~/lib/python/cmk/gui/plugins/metrics/check_mk.py” section “Metrics” and “Perf-O-Meters”
This is also advised to check if your metric is already defined and only the perf-o-meter is missing.
Actually i have added my local plugin inside “/usr/lib/check_mk_agent/plugins” inside the host which i have added in the checkmk and done the full scan of the host in the check so that local service will be visible in the checkmk.
so can we do any further changes related to perf-o-meter in this the host itself .
Since if we are doing any changes in the monitoring that is checkmk server , i guess it will get affected to all the host which is added in the check-mk and i need it should be reflected in that particular host only in the local plugin i have created.
I don’t understand - you want to change your display of information. This can only be done on the monitoring server. You monitored host only produces data that is interpreted and shown by the monitoring system.
I wrote before you can use a well known metric name like my example with the metric name “threads” then you have to do nothing and it shows you a perf-o-meter.
That’s why i also gave you the information about the file with the definitions of the perf-o-meters and metrics known by the system. You can select one and use the metric name in your check - finished.
So under monitoring server
/local/share/check_mk/web/plugins/metrics/mysql.galera_cluster.py
Inside this mysql.galera_cluster.py along with other metric we need to add for our local one for perf-o-meter
since i have the local plugin in the particular host check_mk_agent which gives four out put
echo “$status ELASTIC_SEARCH count=$active_shards $msg” from this host we cant do anything for perf-o-meter
since plugin script i have added in the host server only
and didnt done anything in the checkmk .to check if its working from checkmk
we just do “telnet hostname portno” , to see the plugin output working.
so i mean from that script output (echo “$status ELASTIC_SEARCH count=$active_shards $msg”), we cant do anything.
After your last post i think you don’t read the manual link i posted and also had no look at my example for a local check.
I say it again - the only important part is the name of your metric
For this name the system must know what to do. If you use a well known metric then you have to do nothing as the system already knows how to handle this. If you use a metric name like your generic “count” then you need to tell the system what to do.
This is then where my example is needed as a definition for the “what to do”
Thanks a ton for your patience and all the guiding. But still the issue persist
In you example I guess in your local check in the output you are giving I guess “thread” is your metric name , for me its count:$ active-shards (which I am taking the value from curl output)
Lets take an example
let my monitoring server that is (checkmk server ) be. : abc
and host which is added in the checkmk be : xyz and many other hosts
Now I have created local plugin in “xyz” in “/usr/lib/check_mk_agent/plugins”
and in side that local script at the end I have given
" echo “$status ELASTICSEARCH count=$active_shards $msg”. "
status , service name and count which which give me graph and msg
Now I need perf-o-meter for this count value as well
For that you said we need to do changes in the monitoring server that is in our case is “abc” server . we need to add in this path “/local/share/check_mk/web/plugins/metrics/” right
As in your case your metric name is “thread” and in your example my example
when you save this with thread.py under “/local/share/check_mk/web/plugins/metrics/” with the script
how abc that is checkmk monitoring server get to know this metric saved in “abc” server under “/local/share/check_mk/web/plugins/metrics/” is to be executed for the local check created in the “xyz” host only not any other host added in the “abc” checkmk monitoring server . And how in your example “thread” is the metric name in local check but in the
path you mentioned “/local/share/check_mk/web/plugins/metrics/”
metric_info[“perc”] … “perc” is mentioned. how they are related
It would be good to have only one thread for the same topic and not multiple. @r.sander already gave you a working perf-o-meter only that it was not a 0 to 100 percent scale but logarithmic.
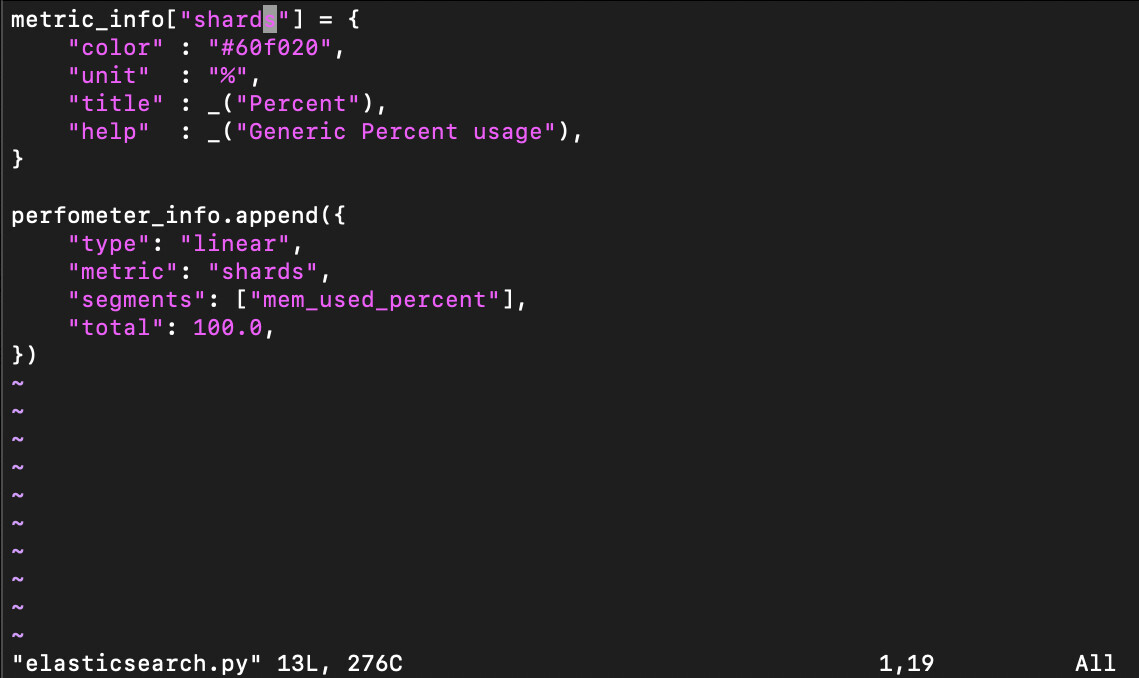
An example for 100 percent perf-o-meter looks like this one.
You cannot redeclare count as a metric with percentage as unit. Count is already used elsewhere and usually has no unit.
active_shards is also not a good metric name is the metrics also does not have percentage as unit. I have not seen this before. You need to come up with a new unique metric name.
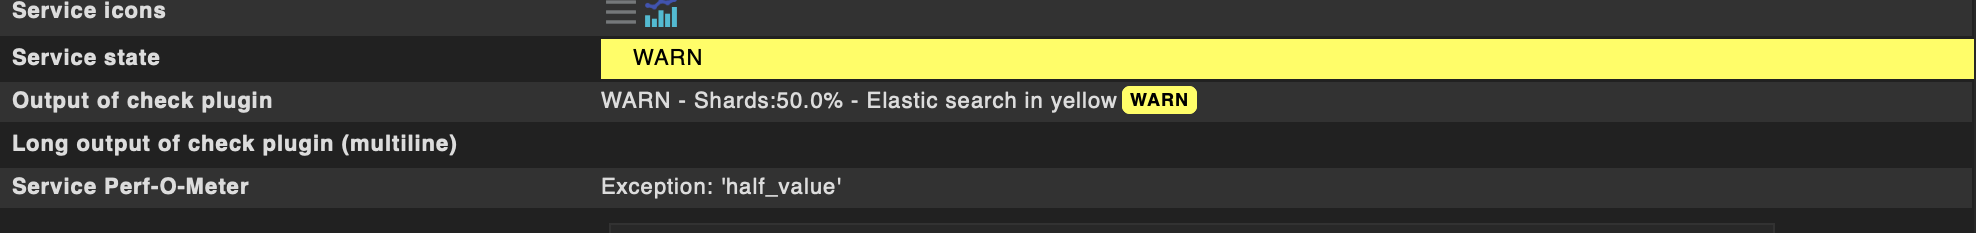
Without doing anything perf-o-meter , I am getting.
So to write my own metrics like this how to resolve above 2 steps . Am I missing anything .
Or is it ok to use any metric name like thread or active_shards so that we don’t have to create any new ?
Please let me know