Performance Data Error

Hi,

Hope you are well.

We want to view load capacity

Our third party provider stated:

You should be able to answer this using Check_MK.

I’ve taken a look and you aren’t monitoring any of the Gig interfaces.

I went to “All Hosts” > hit the blue graph next to “LONHO_ASR_1” > on the right side selected “Interface GigabitEthernet 0/0/0”, this showed up the attached.

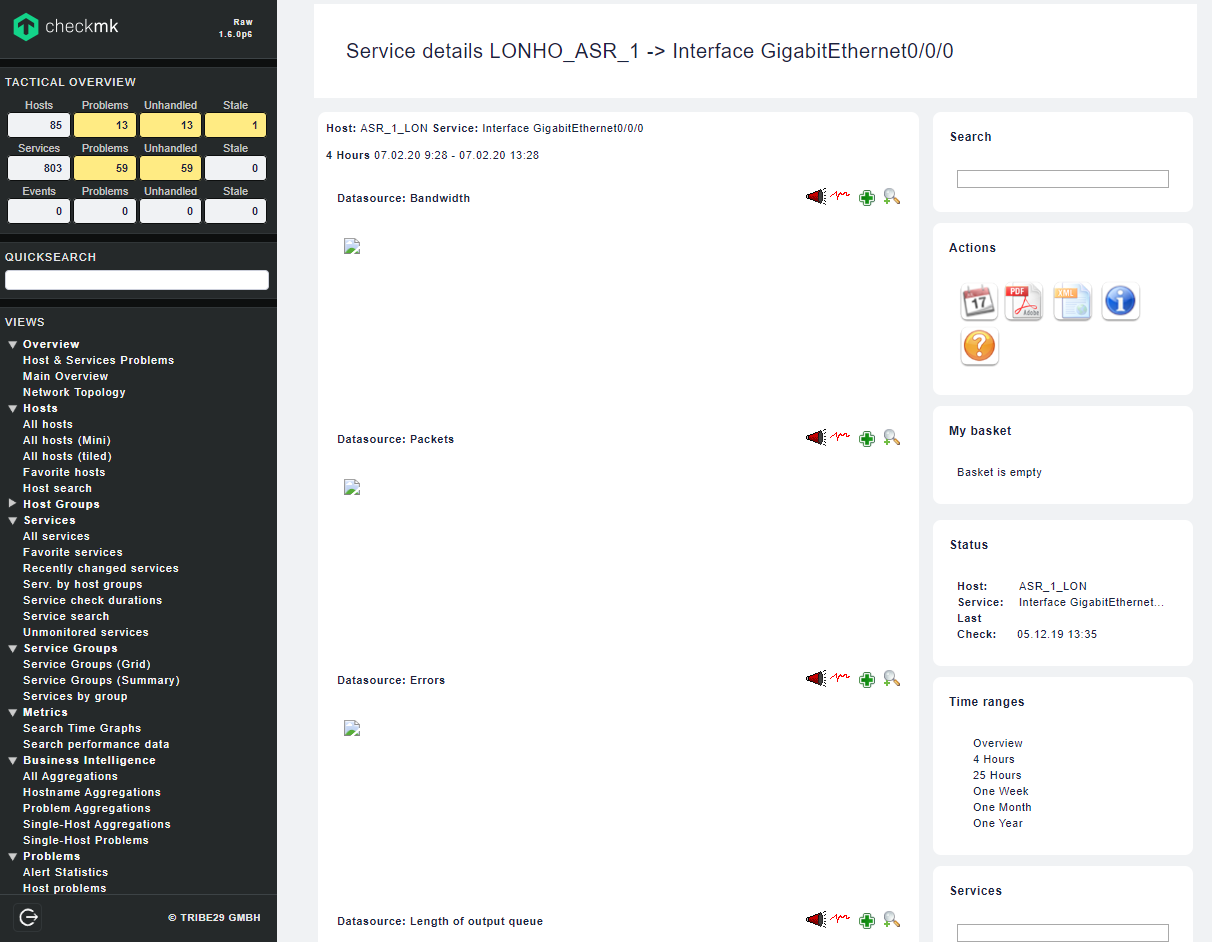
Anyone know what this is and how to fix it?

If I click on a broken graph I get this error message:

PNP4Nagios Version 0.6.26

Please check the documentation for information about the following error.

perfdata directory “/omd/sites/ccycloud/var/pnp4nagios/perfdata/ASR_1_LON” for host “ASR_1_LON” does not exist. Read FAQ online

file [line]:

application/models/data.php [148]:

[back](javascript:history.back()) Actions

[](javascript:history.back())
pnp4nagios-0.6.26 [ 08-21-2017 ]

If you follow that link you get this:

perfdata-dir-for-host

PNP was called with a host in the URL.

Example:

http:///pnp4nagios/graph?host=

The resulting path to the perfdata directory could not be found.

The path is shown in the error message.

var/perfdata/<this-host> will be created by process_perfdata.pl when it processes performance data for this host.

If this directory does not exist there are several possible causes:

  • Passing an incorrect host name in the URL

  • The host has no valid performance data

  • None of the services has valid performance data

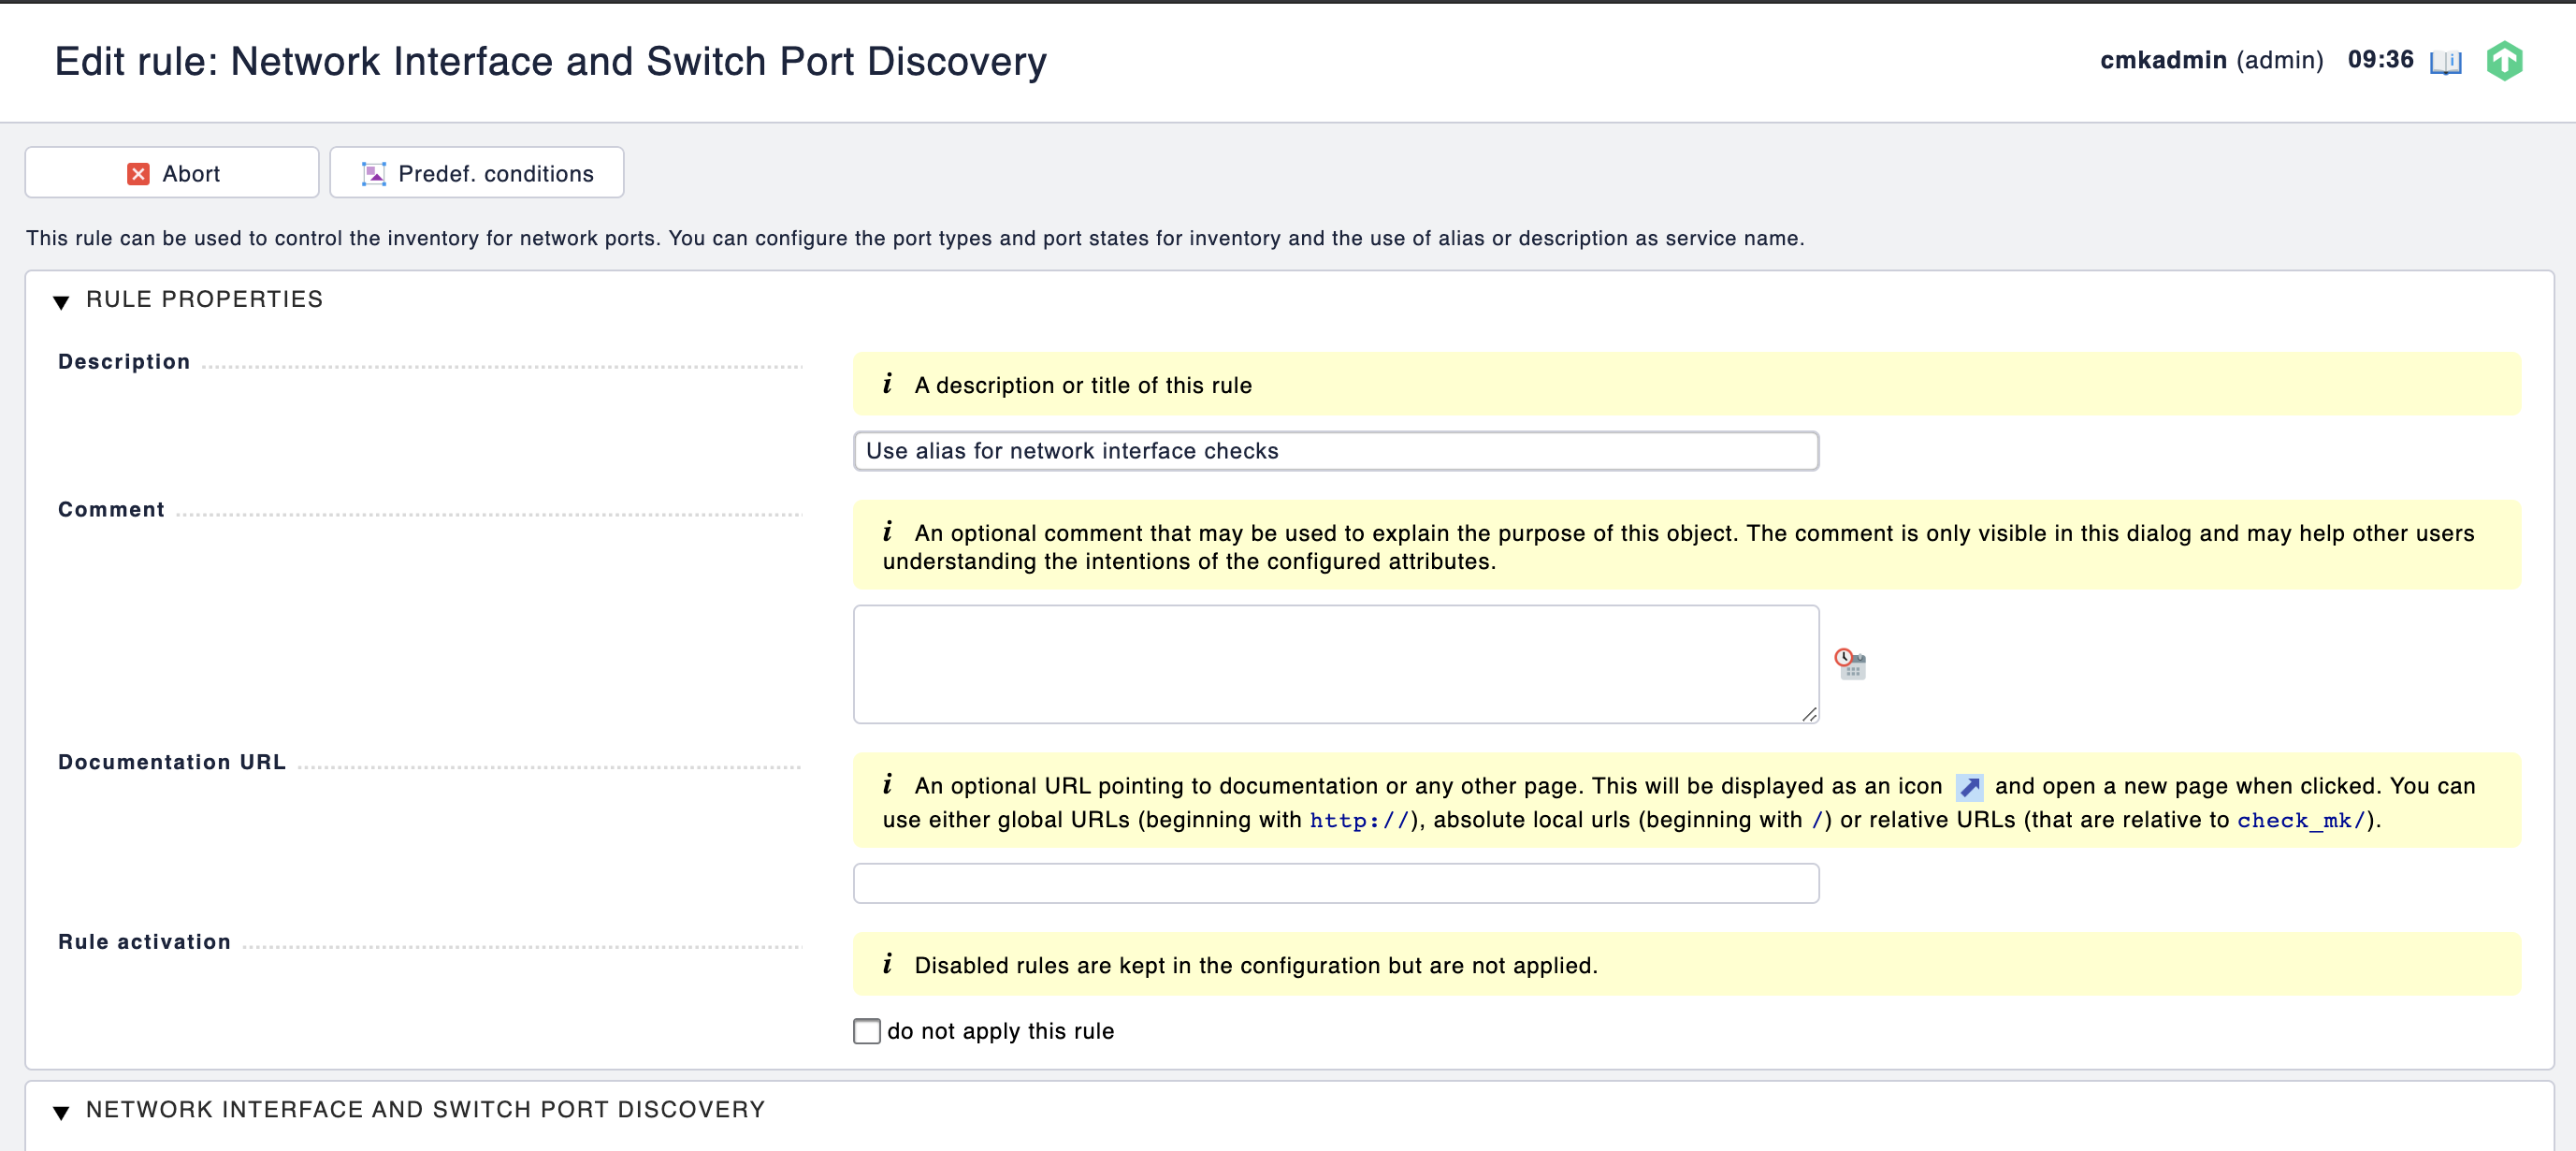
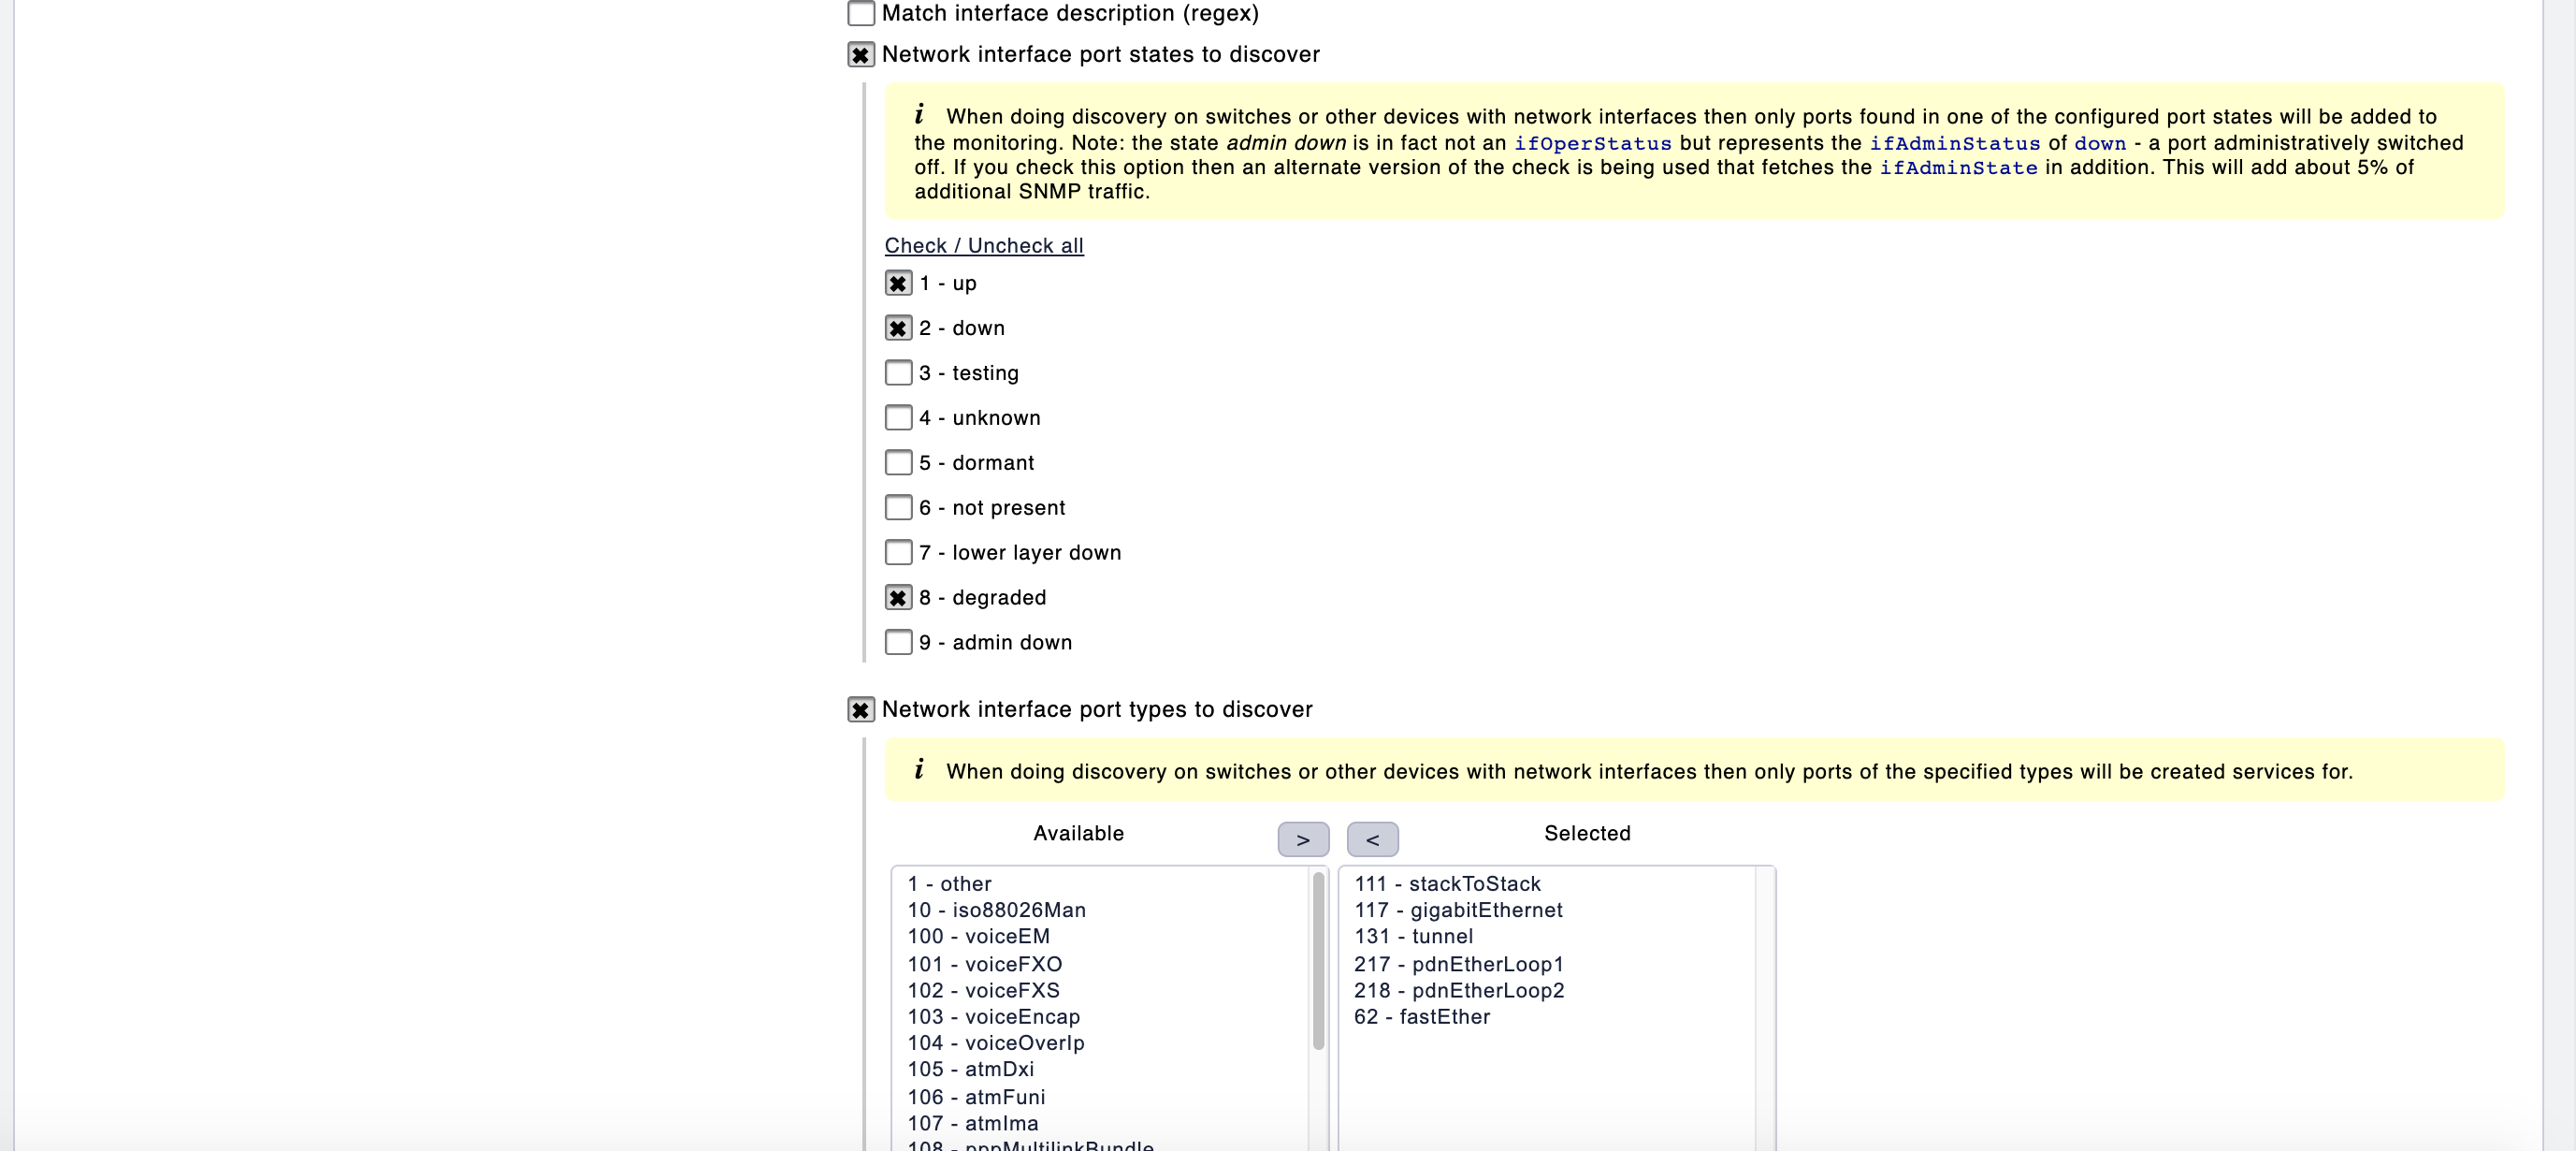
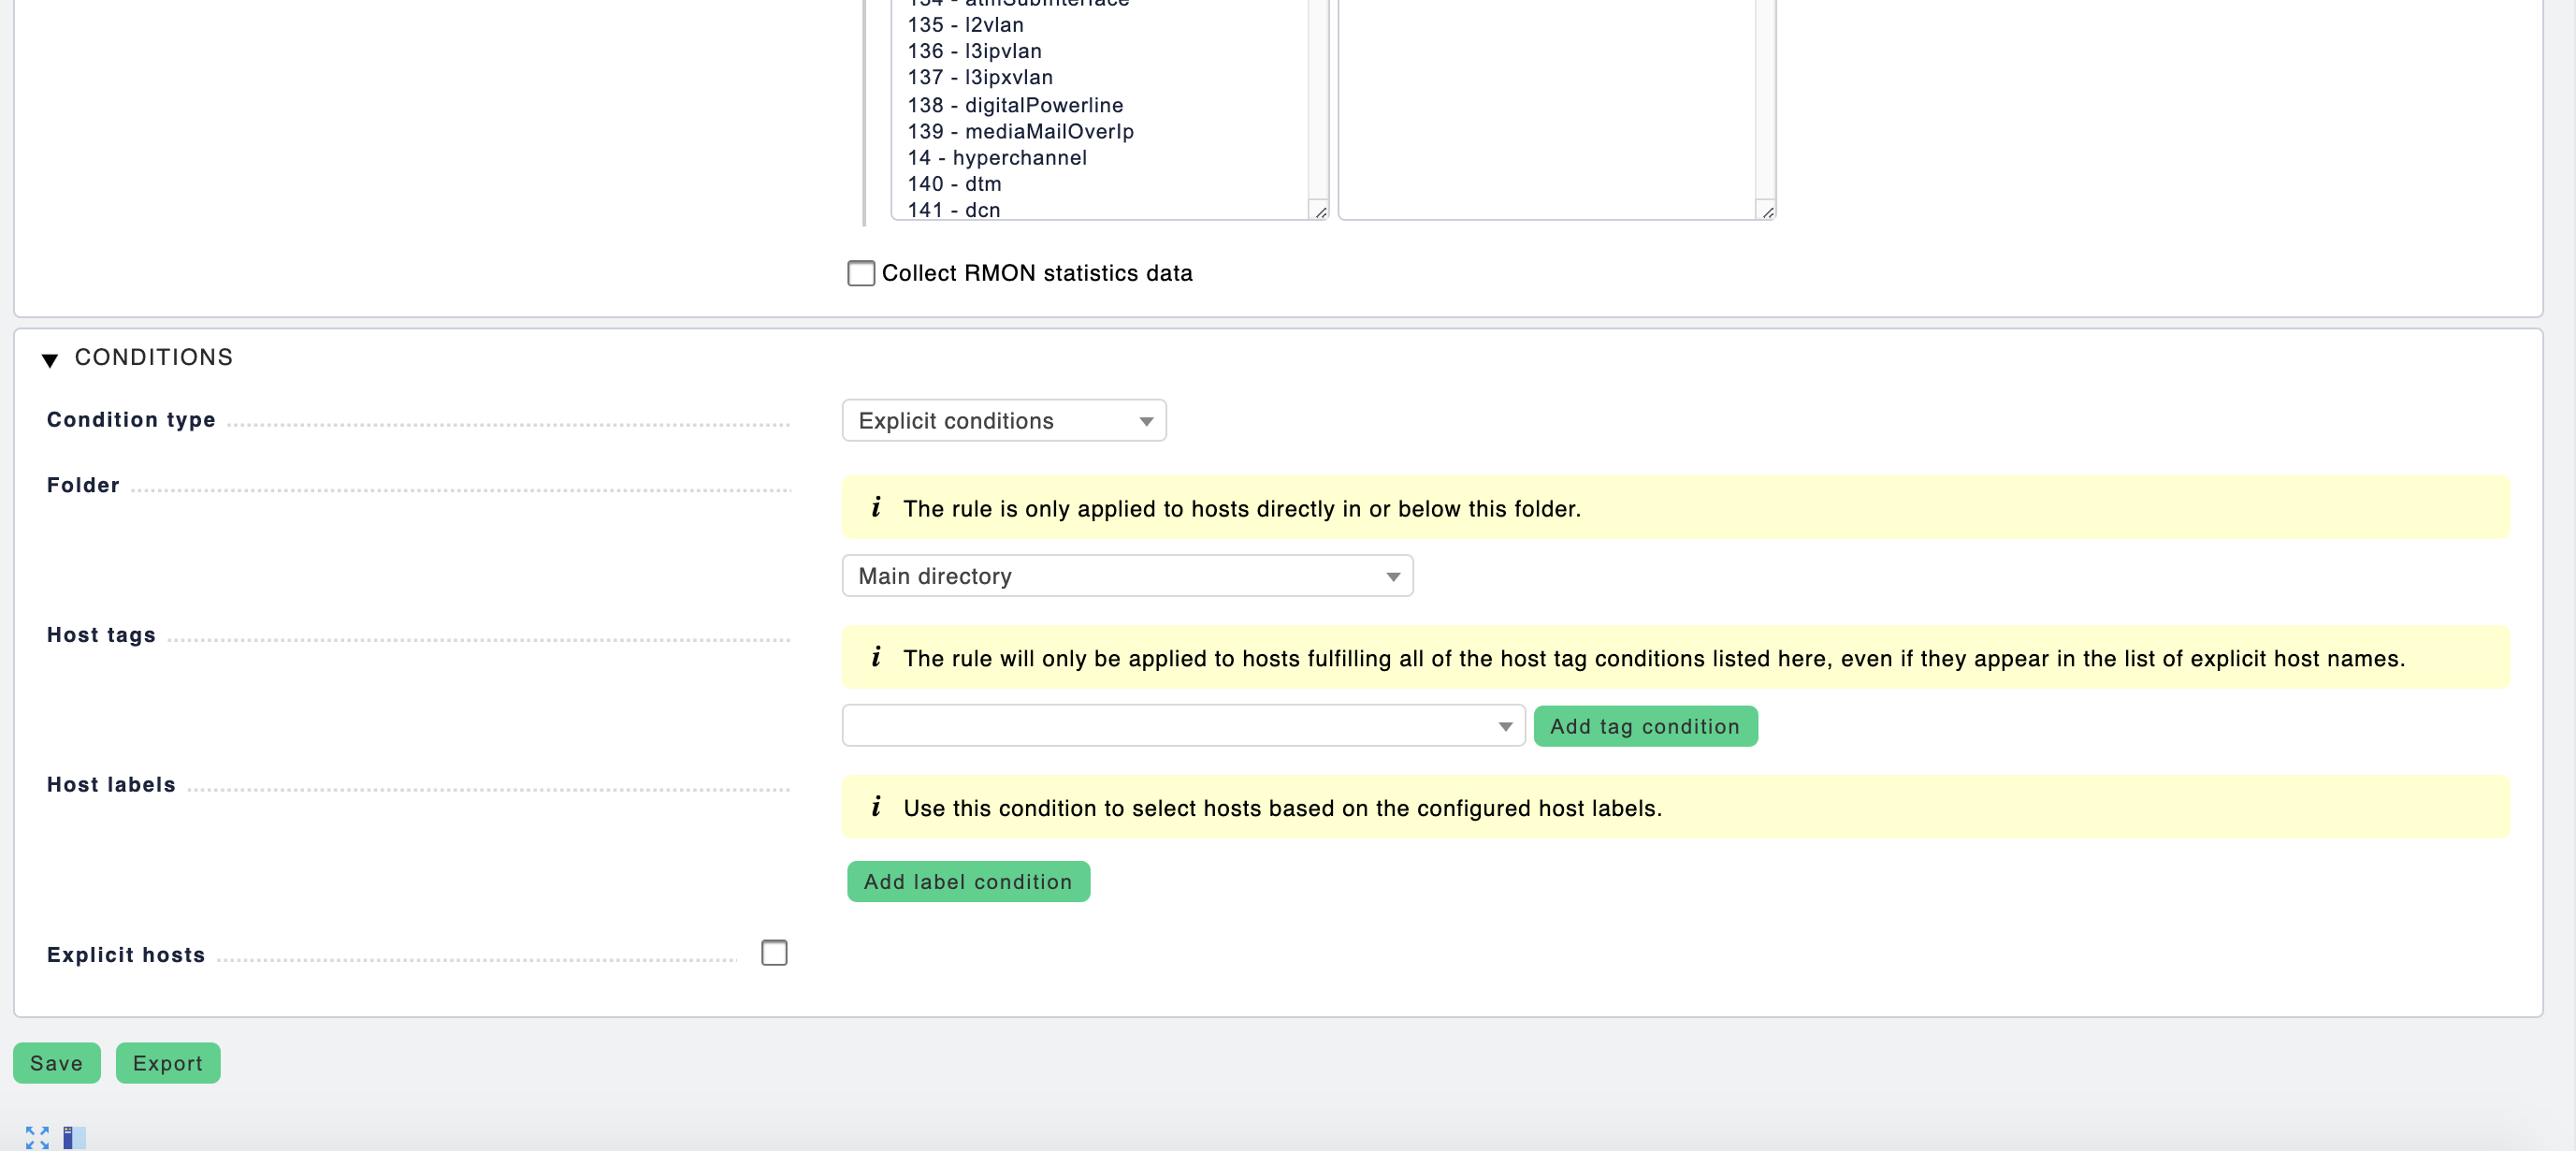
Anyone have any ideas we have a rule configured called Switch Port Discovery:

See Screenshots below:

There are too many information inside your post.
The discovery settings for your interfaces have nothing to do with your problem.

First step is - take a look at the folder “/omd/sites/ccycloud/var/pnp4nagios/perfdata/" on your site ccycloud.
What do you see there?
I think there is no folder with name “ASR_1_LON” right?

Check in your “sidebar” if inside the “Master Control” snap-in the “Performance data” is switched on.

Hi,

I apologise thought it may be related so if I look at the path:

/omd/sites/ccycloud/var/pnp4nagios/perfdata/

There is a folder the folder is called LONHO_ASR_1 inside that folder is this output:

See the next reply as character limit is exceeded

If I check inside the “Master Control” snap-in the “Performance data” is switched on

The output is still too large to post

This is not the name you tried to access graphs for. In your first post it was “ASR_1_LON”.
Is this folder existing inside “/omd/sites/ccycloud/var/pnp4nagios/perfdata/”?

So ASR_1_LON is the old name for LONHO_ASR_1 there is a folder for LONHO_ASR_1 but not for ASR_1_LON wondering if it didn’t update and why?

I created a folder for ASR_1_LON but when I checked the next morning there was no folder.

Don’t create anything manually inside these folders!
It looks more like that your system is not processing any performance data.

I don’t asked if you use the enterprise or raw edition?
If you use the enterprise edition then there are no PNP4Nagios graphs. Only the graphs generated from CMK itself.

Hi,

We use RAW 1.6.0p6

It is interesting because I do get graphs on Packet loss etc

Any suggestions?

Hi,

Hope you are well sorry to be a bother any update?

Please provide some information about the content - files - inside the folder where your performance data is stored.
Important is the something like the last changed data and the size of the files.
Next part of information needed is the performance data output of your interface check. You can find this on the service status page on the bottom.

In your first screenshot you have no graphs for packet loss?

Hi @andreas-doehler,

I can’t seem to find this information can you give me a detailed step by step by any chance