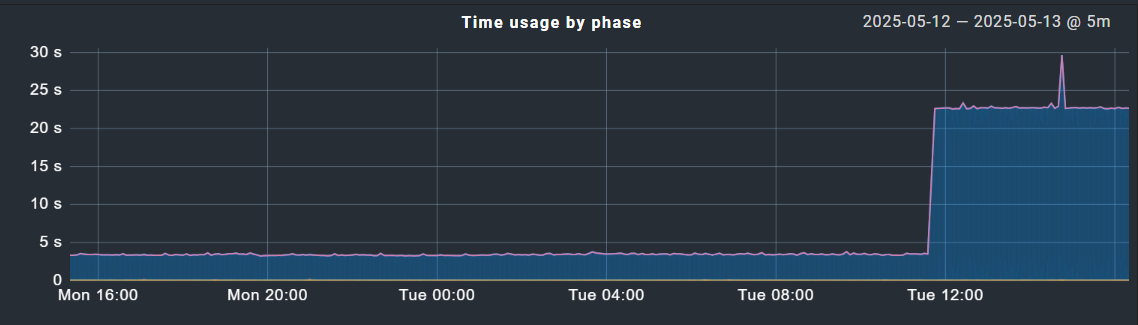
Hello - we are running enterprise CMK 2.3.0p29. Today I ran a bulk service discovery on about 20 hosts to cleanup some old services. After running this, my fetcher helper usage immediately spiked to 100% and simply would not come down. I eventually had to restart the instance and double the number of fetchers to get that number back under control, but it remains much higher than normal. I have made no other changes to the environment. Also strange is that during this time I have noticed extreme latency on the Check_MK service execution time, for example:
The peak in that graph corresponds to when I ran the bulk discovery. Oddly, the time has stayed high despite increasing the number of fetchers, and even more strangely, the host from the graph above was not one of the hosts that I ran bulk discovery on!
CPU, load and memory on the CMK server all are low and seem normal. Did I do something wrong? I’ve run bulk service discovery before but on far less hosts. Any ideas how I can troubleshoot whats happening here?
I don’t think so. As the blue color in the graph is “Time waiting for Checkmk agent”, i don’t think that the reason is directly your CheckMK instance.
Is there something inside your network limiting the traffic from the monitoring to your monitored systems?
Can you reproduce the problem on the command line if you fetch the agent output from such a system manually?
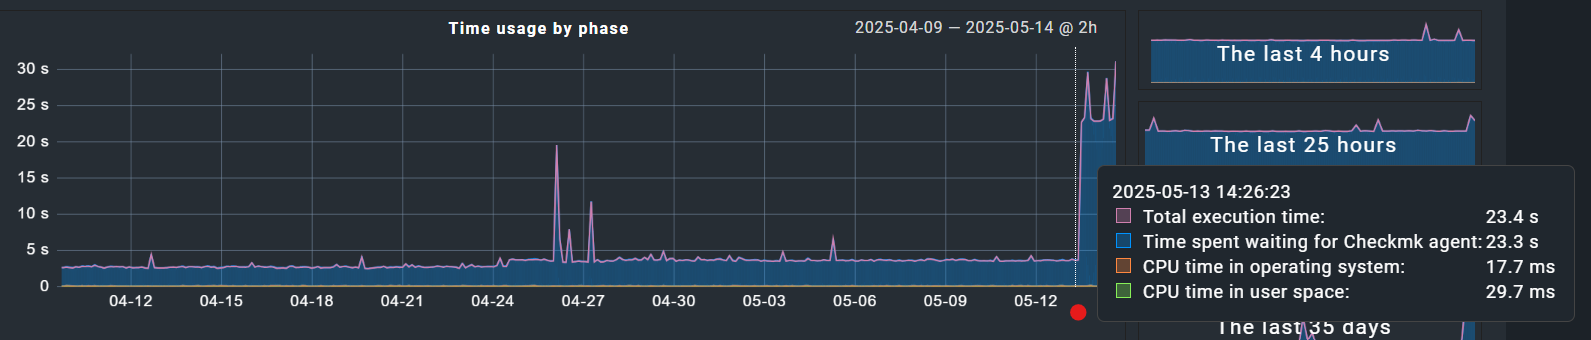
Hi Andreas - thanks, you’re right. I assumed it had something to do with the bulk update since the increased timing corresponds so closely to when I ran the bulk update. Here is a month history for this host and it was very consistent until yesterday right around when I ran my update:
BUT I went onto this host directly and run the following: “C:\Program Files (x86)\checkmk\service\check_mk_agent.exe” test - and that is taking a good 20 seconds before information returns to the console, so the issue clearly lies there.
The only question is why, particularly when I made no changes to this host. Is there a way to get execution timing out of the local agent? All of the data is spit out at once and I cannot tell which section or sections is all of a sudden taking longer to execute.
The agent log is a very good source of information about the execution of the single sections of the agent.
→ “C:\ProgramData\checkmk\agent\log\check_mk.log”
Thanks, I just stumbled on that myself. It appears the total end to end runtime is reported in this line (?) - is that correct?
2025-05-14 15:40:14.661 [srv 2256] perf: Answer is ready in [1122] milliseconds
The timings for this are very consistently around 1 to 2 seconds total, but when I ran that test on the command line, visually it clearly sat there for a good 20 seconds before any data was output, and that seems to correspond to what the server is seeing as the agent latency. This server is only at about 35% CPU utilization so it shouldn’t take that long to spin up the agent and request data. I’ll keep poking around, any further thoughts are appreciated!
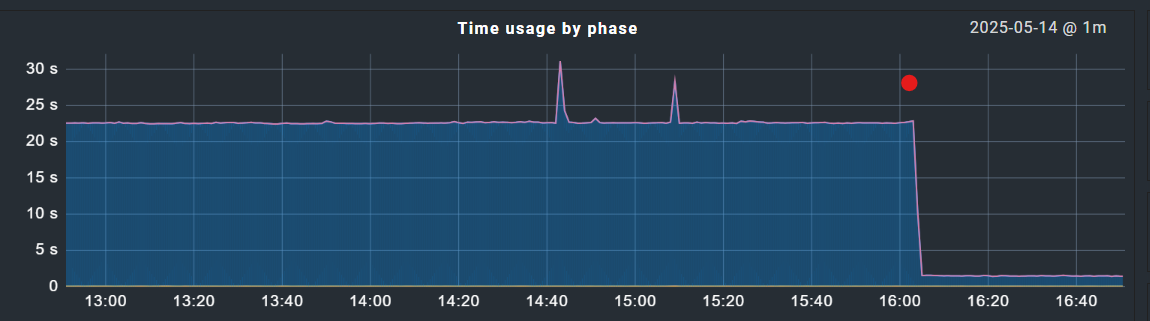
I think I figured this out - somewhat. We upgraded this server to 2.3.0p29 around 3 months back and a number of our monitored agents are still running 2.1.x. I’ve been slowly upgrading these and am probably 50% done. The machine that I have been referencing above was in fact running a 2.1.x agent, I upgraded it and the response time returned to normal:
Looking at our statistics - all of the slow machines are running the older agent, so I will accelerate this rollout. Perhaps Everything was just a little slow and I finally hit a critical mass with the bulk inventory where it became obvious … I’m not really sure. Either way, I plan to (and need to) upgrade the local agents, so that seems to be the solution.
This topic was automatically closed 365 days after the last reply. New replies are no longer allowed. Contact an admin if you think this should be re-opened.