Thank you for your replys.
This plugin is just a test to learn the functioning.
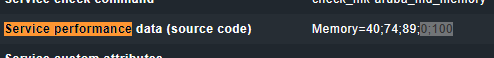
The var output is a string value was permit remove the two first and last chars. Because i didn’t use the parser, the return of memory was [‘40’].
I changed this to use a parser.
I used loop to build a structure, who can to be use of a template or exemple.
For the state=Start.WARN. I corrected ^^’
Yes, I replaced the Metric. Thank you for the example !
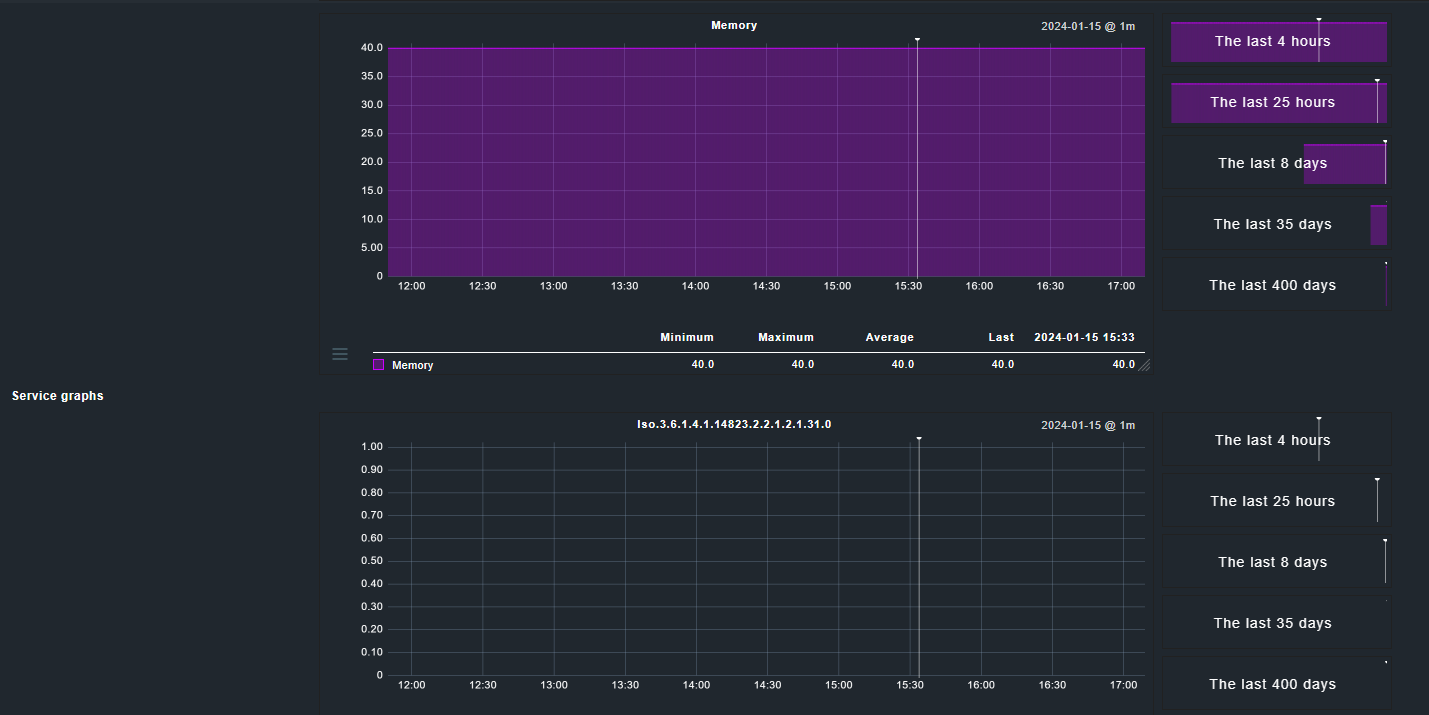
For the main problem.
despite the correction i have always the oid graph…
The new plugin:
#!/usr/bin/env python3
#
#   That plugin check Hardware FAN, Hardware PSU and Used memory
#   Author Mathieu Gallas/Thomas GALLOIS
#
from .agent_based_api.v1 import *
from typing import (
    List,
    Dict,
)
from cmk.base.plugins.agent_based.agent_based_api.v1.type_defs import (
    StringTable,
    DiscoveryResult,
)
## SNMP ##

def parse_aruba_md(string_table: List[StringTable]) -> Dict:

#    oid_tree = {"HWFAN": 0, "HWPSU": 1, "RAM": 2}
    oid_tree = {"HWPSU": 0, "RAM": 1}
    parsed = {}

#    parsed["HWFAN"] = {}
#    for HWFAN_1, HWFAN_2, HWFAN_3, HWFAN_4, HWFAN_5 in string_table[oid_tree["HWFAN"]]:
#        parsed["HWFAN"] = {
#            "state_fan1": int(HWFAN_1),
#            "state_fan2": int(HWFAN_2),
#            "state_fan3": int(HWFAN_3),
#            "state_fan4": int(HWFAN_4),
#            "state_fan5": int(HWFAN_5),
#        }

    parsed["HWPSU"] = {}
    for HWPSU_1 in string_table[oid_tree["HWPSU"]]:
        parsed["HWPSU"] = {
            "state_PSU1": HWPSU_1,
        }

    parsed["RAM"] = {}
    for memory_1 in string_table[oid_tree["RAM"]]:
        parsed["RAM"] = {
            "used_memory": memory_1,
        }

    return parsed

register.snmp_section(
    name = "aruba_md",
    parse_function = parse_aruba_md,
    parsed_section_name = "aruba_md_parsed",
    detect = startswith(".1.3.6.1.2.1.1.1.0", "ArubaOS"),
    fetch = [
 #       SNMPTree(
 #           base = '.1.3.6.1.4.1.14823.2.2.1.2.1.17.1.2',
 #           oids = [
 #               '0',    #FAN 1 STATE
 #               '1',    #FAN 2 STATE
 #               '2',    #FAN 3 STATE
 #               '3',    #FAN 4 STATE
 #               '4',    #FAN 5 STATE
 #           ],
 #       ),
        SNMPTree(
            base = '.1.3.6.1.4.1.14823.2.2.1.2.1.18.1.2',
            oids = [
                '0',    #PSU 1 STATE
            ],
        ),
        SNMPTree(
            base = '.1.3.6.1.4.1.14823.2.2.1.2.1.31',
            oids = [
                '0',    #Used memory in %
            ],
        ),
    ],
)


## Hardware FAN plugin ## HWFAN

#def discover_aruba_md_HWFAN(section) -> DiscoveryResult:
#        yield Service()

#def check_aruba_md_HWFAN(section):
#    count=0
#    countsection=len(section["HWFAN"])
#    for key in section["HWFAN"]:
#       if key == 1:
#            count=count+1
#    if count == countsection:
#        yield Result(state=State.OK, summary=f"{countsection}/{count} FAN OK")
#    elif count > countsection:
#        yield Result(state=State.CRIT, summary=f"{countsection}/{count} FAN OK")
#    else:
#        yield Result(state=State.UNKO, summary=f"Error with value {countsection}")

#register.check_plugin(
#    name = "aruba_md_HWFAN",
#    sections = ["aruba_md_parsed"],
#    service_name = "Hardware FAN",
#    discovery_function = discover_aruba_md_HWFAN,
#    check_function = check_aruba_md_HWFAN,
#)

## Hardware PSU ##

def discover_aruba_md_HWPSU(section) -> DiscoveryResult:
    yield Service()

def check_aruba_md_HWPSU(section):
    count=0
    countsection=len(section["HWPSU"])
    for item in section["HWPSU"]:
        for key in section["HWPSU"][item]:
            if int(key) == countsection:
                count=count+1
    yield from check_levels(
        value=count,
        label='Fan ok',
        levels_lower=(1, 1),
        render_func=lambda v: "%1a / 1" % v ,
        boundaries=None,
    )


register.check_plugin(
    name = "aruba_md_HWPSU",
    sections = ["aruba_md_parsed"],
    service_name = "Hardware PSU",
    discovery_function = discover_aruba_md_HWPSU,
    check_function = check_aruba_md_HWPSU,
)

## Memory ##

def discover_aruba_md_memory(section):
    yield Service()

def check_aruba_md_memory(section):
    for item in section["RAM"]:
        for key in section["RAM"][item]:
            yield from check_levels(
                value=float(key),
                label='Used',
                boundaries=(0,100),
                metric_name='Memory',
                levels_upper=(74, 89),
                render_func=render.percent,
            )

register.check_plugin(
    name = "aruba_md_memory",
    sections = ["aruba_md_parsed"],
    service_name = "Memory",
    discovery_function = discover_aruba_md_memory,
    check_function = check_aruba_md_memory,
)