Hello,
We’re monitoring some remote systems through different WAN links from our HQ.
We have set up 3 IP addresses (normal + 2 additional) for each remote system and then created a “Check hosts with PING (ICMP Echo Request)” rule, with the idea that:
- WAN1=ping normal IP,
- WAN2=ping index #1 additional IP
- WAN3=ping index #2 additional IP
Pinging works fine, but I’ve then created a dashboard with the overall status or the WAN links and the problem I’m facing is that I want to have distinct columns for each one of the WAN links, but there is no option in the drop down menu (see screenshot below):
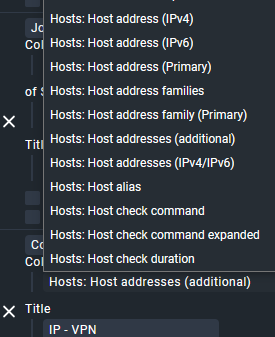
I can only select primary, additional, and either all IPv4 or IPv6 addresses, but no option to display a specific additional IP by index.
Anyone with any tips/hacks or ideas on how to achieve this?
Thanks in advance,
Pavlos