Hello Community,
I have received two alerts reporting a 100% packet loss. However, in the graph the maximum packet loss value is 60%.
Is there any explanation for this?
Versions CFE 2.1.0p22
Regards, thanks
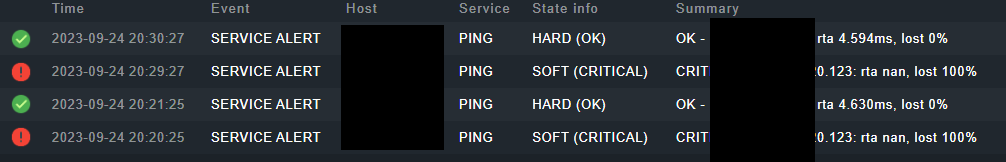
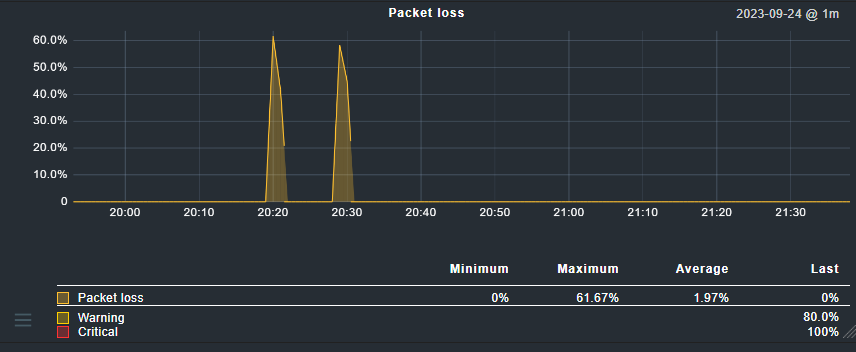
Hello Community,
I have received two alerts reporting a 100% packet loss. However, in the graph the maximum packet loss value is 60%.
Is there any explanation for this?
Versions CFE 2.1.0p22
Regards, thanks
The problem is a little bit tricky here. As you use the CFE i think your host check is the smart ping or?
Second question - do created own rules for the RRD creation?
→ Configuration of RRD databases of services
If there are some own rules present, then these configuration are relevant for the “problem”.
Next question, is your normal check interval for this PING one minute? The retry interval i see is one minute.
All these factors can lead to such a graph.
Here a nice text about the internals of RRD storage.
http://rrdtool.vandenbogaerdt.nl/process.php
Thank you very much again Andreas. Looks like an interesting article, I’ll read it later.
This topic was automatically closed 365 days after the last reply. New replies are no longer allowed. Contact an admin if you think this should be re-opened.