Hello All,
I am using the plugin for monitoring databases [mk_oracle]. This plugin discovers 5 alerts. I want to know if this same plugin can discover any alert related to database disk I/O.
Or another plugin is needed.
Regards,
Vix
Hello All,
I am using the plugin for monitoring databases [mk_oracle]. This plugin discovers 5 alerts. I want to know if this same plugin can discover any alert related to database disk I/O.
Or another plugin is needed.
Regards,
Vix
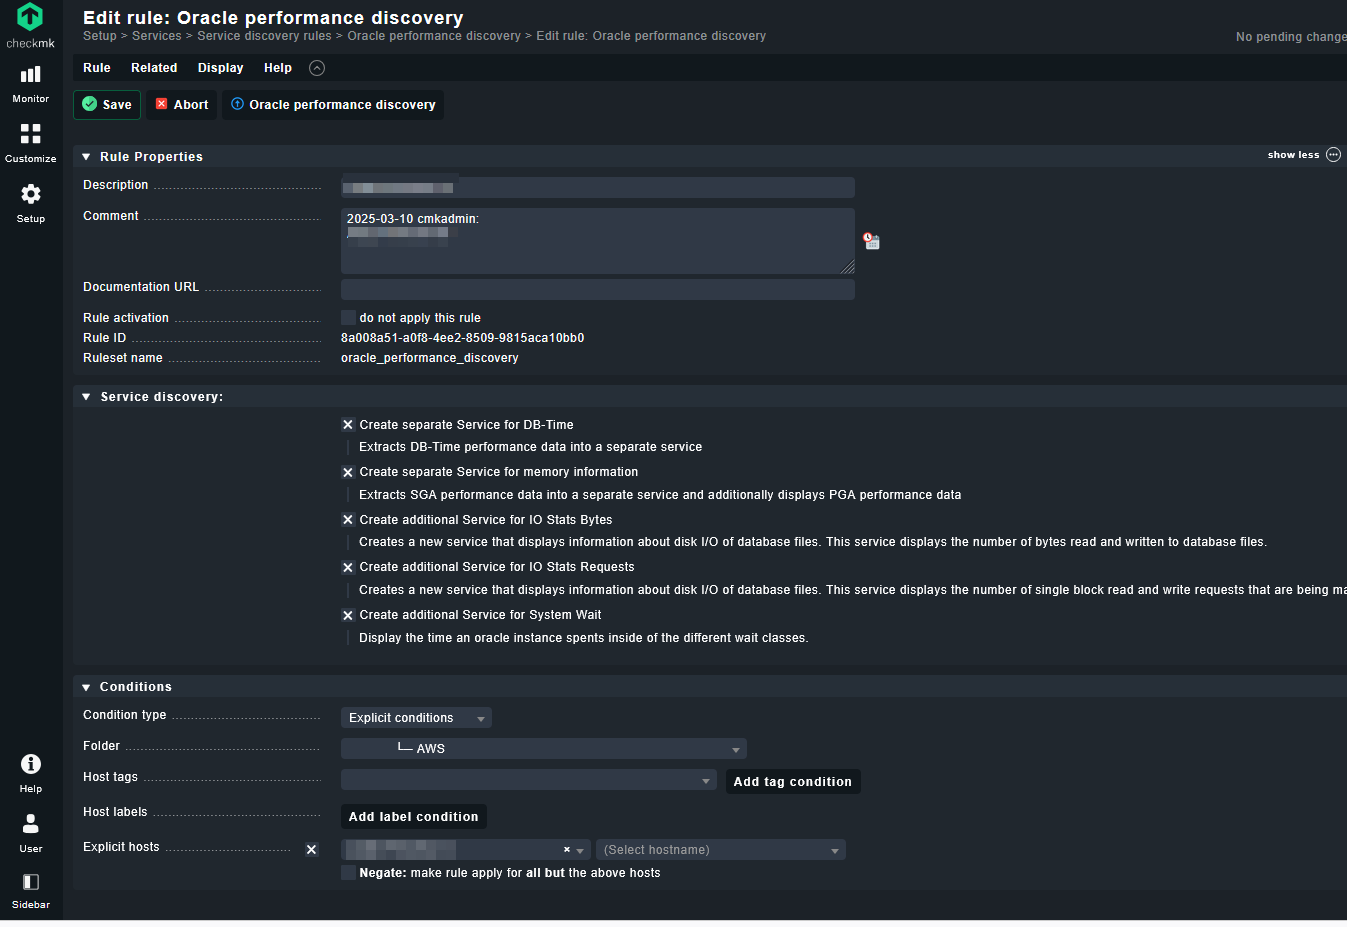
You can setup the Oracle plugin to report IO stats for each instance using the rule “Oracle performance discovery” which provides options to collection additional performance related metrics.
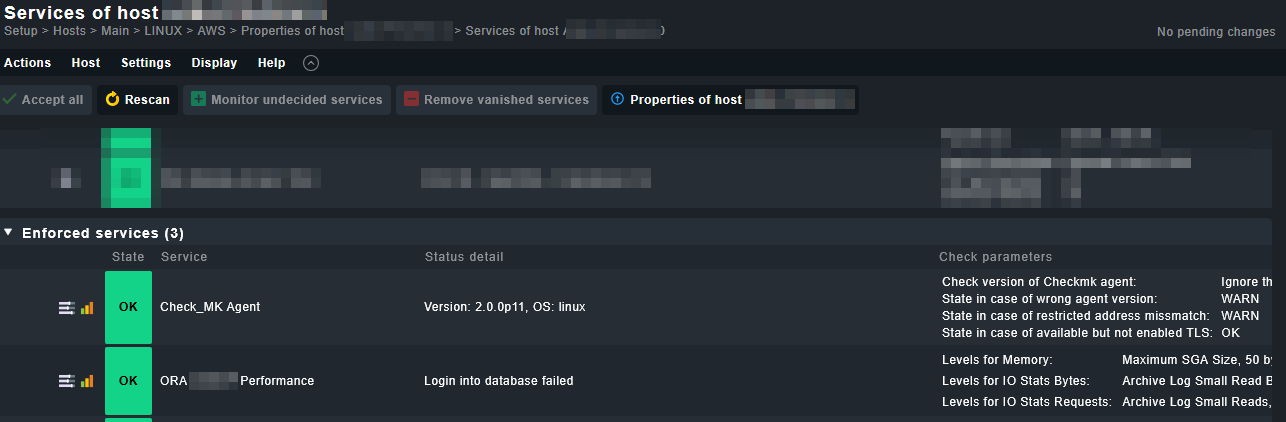
Hello burgeau, thanks for the reply, I have configured the three oracle performance options shown in the image.

*The Oracle performamce option does not add any alerts, not even by applying a rescan.
***The Oracle Performance option located in service monitoring rules also does not add any alerts.
***The Oracle Performance option in the Enforced services section adds a performance alert but leaves it in pending status.
If I go to the Service Configuration option on the server where I require the alert, it appears in green but with the following message in status detail: Login into database failed
You only need to set the “Oracle Performance Discovery” under the “Service Discovery Rules” for now.
Can you post your mk_oracle.cfg file? Please make sure to obfuscate any credentials.
Hi Burgeau,
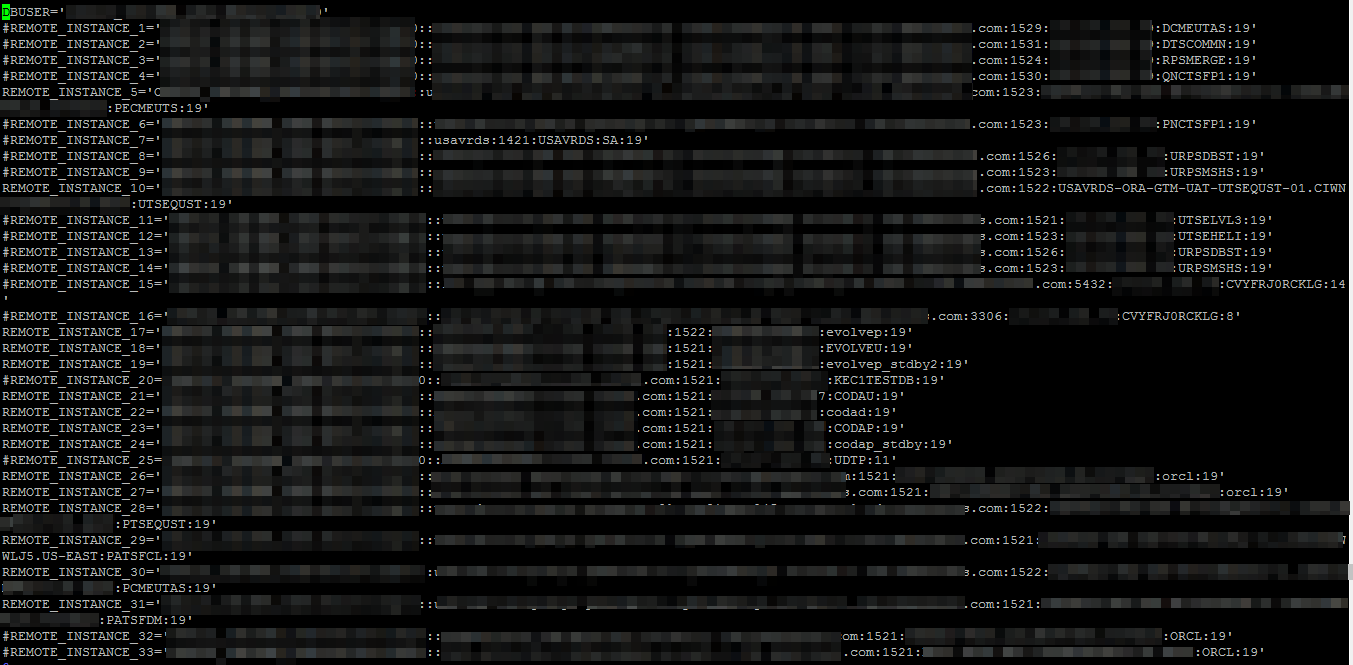
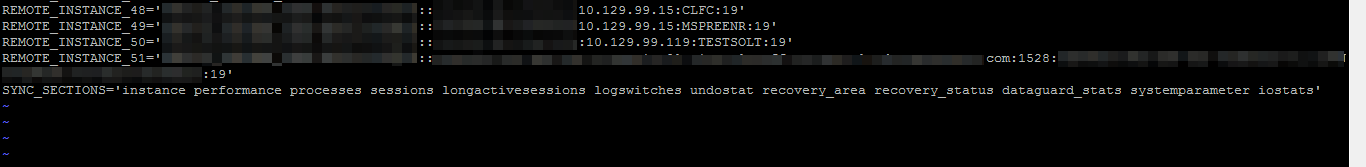
I am sharing an image of the .cfg file and I have left the Oracle Performance Discovery rule configured.
Thanks - do you have the SYNC_SECTIONS parameter configured as well for the remote instances?
No, I don’t have any of that set up. I’ve heard it so far.
In the .CFG file I only have configured what I have sent in the image
Try adding the following to the mk_oracle.cfg file:
SYNC_SECTIONS='instance performance processes sessions longactivesessions logswitches undostat recovery_area recovery_status dataguard_stats systemparameter iostats'
Note the “iostats” metric on the list - this needs to be present to collect the IO metrics from Oracle. In previous versions the default mk_oracle.cfg file did not include this config and it needed to be added manually.
Sorry, should those lines go at the beginning or at the end?
At the end of the file is ok.
Thanks a lot, I’ve added it and I don’t see any changes, I just noticed that in the Systemd Service Summary alert it told me [collector, oracle-tfa]
I don’t know if those should be running.
I’ll check with the Linux team tomorrow.
Those services are fine (collector, oracle-tfa).
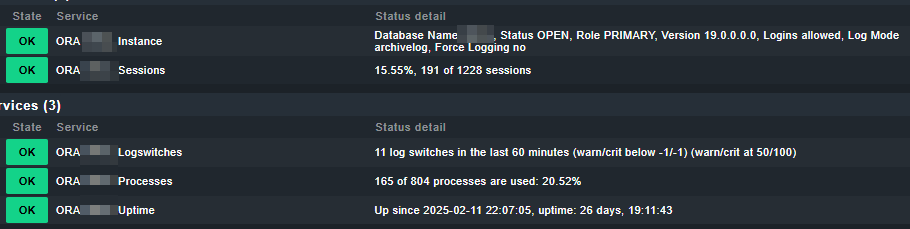
Did you run a discovery on the host after modifying the mk_oracle.cfg? If not then re-run a discovery and you should see the instance specific performance services show up.
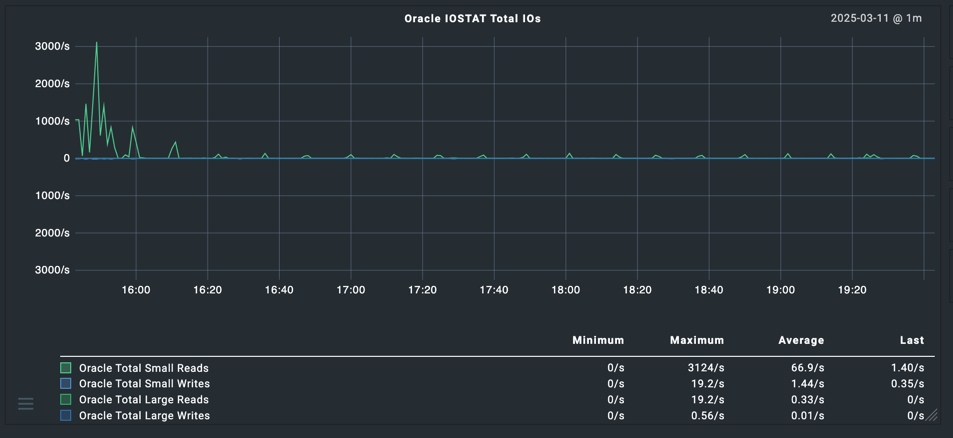
This is what the service names should look like along with some sample metrics (test system which is quiet at the moment but gives the idea):
I’ve configured the rule on another server, but it still doesn’t discover anything.
The services are running, but there’s still no discovery.
I’ve forced a rescan several times, but it doesn’t find any new information.
Regards,
Vix
Are you able to run the mk_oracle plugin from the command line and check that the section “<<<oracle_performance:sep(124)>>>” is output?
From the command line on the server that you are running the remote checks on do the following:
export MK_CONFDIR=/etc/check_mk
export MK_VARDIR=/var/lib/check_mk_agent
cd /usr/lib/check_mk_agent/plugins/60
./mk_oracle -d
From the screen output you should see the section “<<<oracle_performance:sep(124)>>>” listed along with the iostat_file metrics for each file type.
Try on just one database first to make sure its working ok.
Also - are these databases CDB/PDB or non-CDB?
Thanks for your answers.
I still can’t see the alerts applying a rescan to the server.
I ran the following lines from /usr/lib/check_mk_agent/plugins
export MK_CONFDIR=/etc/check_mk
export MK_VARDIR=/var/lib/check_mk_agent
./mk_oracle -d
I don’t see the following line in the output:
oracle performance:sep(124)
In the attached file you can see the result, just add on the instance that I have configured the Oracle Performance Discovery alert
PERFORMANCE.txt (5.8 KB)
Also - are these databases CDB/PDB or non-CDB?
instance name cdb_cluster FALSE TRUE
instance name cdb_cluster_name TRUE
instance name standby_pdb_source_file_directory TRUE
instance name standby_pdb_source_file_dblink tRUE
instance name remote_recovery_file_dest TRUE
instance name disable_pdb_feature 0 TRUE
instance name pdb_lockdown tRUE
instance name pdb_template TRUE
oracle_tablespaces:sep (124)
oracle_resumable:sep (124)
instance name
I don’t see any .cfg files in this path. Is that correct?
/var/lib/check_mk_agent

Regards.
Vix
Correct - mk_oracle.cfg should be in /etc/check_mk.
A couple of things:
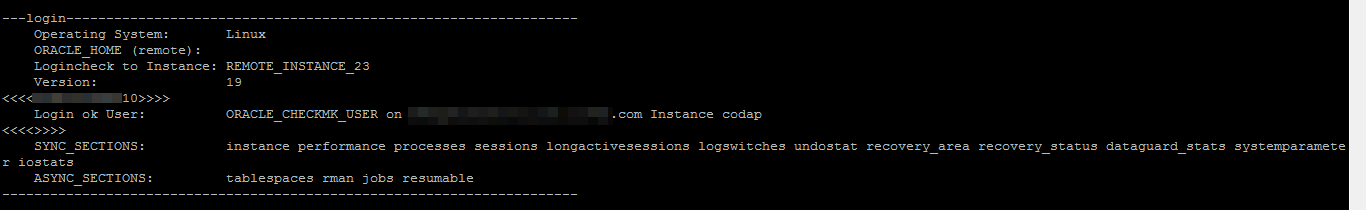
SYNC_SECTIONS="instance performance processes sessions longactivesessions logswitches undostat recovery_area recovery_status dataguard_stats systemparameter iostats"
ASYNC_SECTIONS="tablespaces rman jobs resumable"
By default the iostats will be run as an ASYNC check but for now just want to make sure it runs ok with the sync checks.
Run the following to check the connectivity:
export MK_CONFDIR=/etc/check_mk
export MK_VARDIR=/var/lib/check_mk_agent
cd /usr/lib/check_mk_agent/plugins/60
./mk_oracle -t -l
Take a look through the log file created and make sure that the DB connections are being established ok.
Can you paste the DDL for the create user command for the Checkmk Oracle db user?
Thanks for responding.
This is the content of the following paths.
/etc/check_mk/

/var/lib/check_mk_agent
I have added the lines you commented in the following file: mk_oracle.cfg
In the path: /usr/lib/check_mk_agent/plugins
I executed the following lines:
export MK_CONFDIR=/etc/check_mk
export MK_VARDIR=/var/lib/check_mk_agent
CD /usr/lib/check_mk_agent/plugins/
./mk_oracle -t -l
Can you paste the DDL for the create user command for the Checkmk Oracle db user?
I haven’t created any users in Check_MK.
The username and password I use are those provided to me by the database team admin.
I have done the above and applied a rescan to the server and it still finds the alerts.
Regards.
VIX
Single quotes around the SYNC_SECTIONS and ASYNC_SECTIONS - apologies as the copy & paste was incorrect on the above update.
Can you confirm with the DBA team that the Checkmk DB user has been granted SELECT_CATALOG_ROLE as per instructions here under section 2.1.
Note - if these are CDB/PDB you need to use the setup described under “Multi-tenant databases” to make sure that the checkmk Oracle user has the correct permissions.
I recall an issue in the past where the performance metrics were not displayed due to missing permissions on the checkmk Oracle DB user not being able to see the v$iostat_file view.
Also - can you set the version to the RU specific release number…ie…instead of using 19 in the REMOTE_INSTANCE definition use 19.25 or whatever the current RU version is for these databases.
The SQL that outputs the iostats data is as follows:
sql_iostats() {
    if [ "$NUMERIC_ORACLE_VERSION" -ge 121 ]; then
        echo 'PROMPT <<<oracle_performance:sep(124)>>>'
        echo "WITH iostat_file AS (
                SELECT con_id,
                    filetype_name,
                    SUM(large_read_reqs) large_read_reqs,
                    SUM(large_read_servicetime) large_read_servicetime,
                    SUM(large_write_reqs) large_write_reqs,
                    SUM(large_write_servicetime) large_write_servicetime,
                    SUM(small_read_reqs) small_read_reqs,
                    SUM(small_read_servicetime) small_read_servicetime,
                    SUM(small_sync_read_reqs) small_sync_read_reqs,
                    SUM(small_write_reqs) small_write_reqs,
                    SUM(small_write_servicetime) small_write_servicetime,
                    SUM(small_read_megabytes * 1024 * 1024) small_read_bytes,
                    SUM(large_read_megabytes * 1024 * 1024) large_read_bytes,
                    SUM(small_write_megabytes * 1024 * 1024) small_write_bytes,
                    SUM(large_write_megabytes * 1024 * 1024) large_write_bytes
                FROM v\$iostat_file
                GROUP BY con_id,
                    filetype_name
            )
            SELECT upper(
                    DECODE(
                        d.cdb,
                        'NO',
                        i.instance_name,
                        i.instance_name || '.' || vd.name
                    )
                )
                || '|iostat_file'
                || '|' || filetype_name
                || '|' || small_read_reqs
                || '|' || large_read_reqs
                || '|' || small_write_reqs
                || '|' || large_write_reqs
                || '|' || small_read_servicetime
                || '|' || large_read_servicetime
                || '|' || small_write_servicetime
                || '|' || large_write_servicetime
                || '|' || small_read_bytes
                || '|' || large_read_bytes
                || '|' || small_write_bytes
                || '|' || large_write_bytes
            FROM iostat_file io
                JOIN v\$containers vd ON io.con_id = vd.con_id
                JOIN v\$instance i ON 1 = 1
                JOIN v\$database d ON 1 = 1
            ORDER BY vd.con_id,
                io.filetype_name;"
    fi
}
See how the section “if [ “$NUMERIC_ORACLE_VERSION” -ge 121” determines if this runs - i’m thinking that due to the version number being “19” for some reason it is returning a NUMERIC_ORACLE_VERSION less than 121.
Burgeau, Thank you so much for your help and patience. I was able to see the alerts I needed. The solution was to add the full version number. Example: 19.0.
When I changed that information and ran the scan, it found the alerts.
One more question: I have DataGuard instances configured. On one server, the alert is green, which is correct because it’s running there. However, the standby server is mounted and is in critical status.
Do you think adding the following lines to the .cfg file will resolve the critical status alert?
#SYNC_SECTIONS=‘instance sessions logswitches undostat recovery_area processes recovery_status longactivesessions dataguard_stats performance locks’
#ASYNC_SECTIONS=‘tablespaces rman jobs ts_quotas resumable’
No problem - please mark the question as solved.
For data guard - setup the services as follows:
# Sections to run in foreground and wait for the result
SYNC_SECTIONS='instance processes recovery_area recovery_status dataguard_stats systemparameter'

# Sections to run in the background, at a slower interval cached
ASYNC_SECTIONS='rman'
For the ASYNC_SECTIONS you can set as ‘’ if you don’t run RMAN backups from the standby.
For the SYNC_SECTIONS - these are the services to monitor for a mounted standby. Make sure to use SYSDBA connection option in the REMOTE_INSTANCE definition. This configuration will show the dataguard service after which you can apply settings to monitor the log transport and apply lag etc.