CMK version:
Checkmk Raw Edition 2.2.0p5
OS version:
Linux SUSE SLES 15 SP5
Problem description:
Hello everyone!
I am new to CheckMK and I am trying to monitore our applications that are running on a TomCat.
This have to be monitored on different servers, and many servers have several TomCats with different Ports that have to be monitored.
On every TomCat Installation, we have a Jolokia on the WebApps

It is functional and works when invoked via the URL, for example http://localhost:8081/jolokia
Now we have to add it to CheckMK and this is where we have problems.
First approach: Jolokia rule on GUI - Problem, only one port is monitored
The first thing I tried was to add the check via the GUI of CheckMK.
First, I checked this box on the host:

Then I added a Jolokia rule for the port and host I want to monitor:
Setup > Agents > Other integrations > Jolokia

And I configured the rule like this:

Note:
I used the Explicit Hosts option so that the port would only be listened on the specified hosts.
After that, I committed the change and ran service discovery.
So far so good.
But the thing is, there are multiple TomCats on the same host with different ports, and they all need to be monitored.
So I repeated the same process with the Jolokia rule, but with a different port for the same host.
The problem is that only one port is monitored. I think this is a rule problem, where if one rule matches, the others are ignored and not monitored.
So it checks if there is a port 8080 for example, and it finds the services to monitor, but I also want the port 8081 to be monitored with jolokia, but CheckMK can’t do it.
Something to do with this:

But I could not find a way to monitor all ports at once.
So I tried another approach.
Approach 2: Monitor Jolokia using a Python script for CheckMK
Since the first approach did not work, we tried another solution.
We found that there is this Python script that we could use to monitor multiple instances of Jolokia
So we installed Python on the host PC and copied mk_jolokia.py to the C:\ProgramData\checkmk\agent\plugins folder on the host PC.
We also copied the jolokia.cfg file to the C:\ProgramData\checkmk\agent\config folder and edited it as follows
suburi = "jolokia"

instance = None

port = 8081

server = localhost
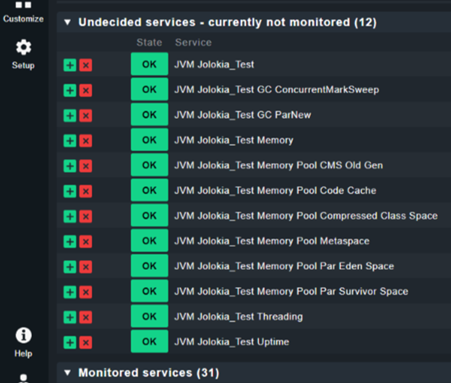
Then we restarted the CheckMK service on the PC and ran service discovery for the host where we installed the script.
A JVM service was detected, but it was displayed in orange with a message that it required the requests library.
So we installed the library on the host by opening cmd and writing pip install requests.
Then we restarted the CheckMK service and ran the service discovery again, but nothing new was discovered, including the JVM check that was previously shown with an error.
We checked the logs on the host at C:\ProgramData\checkmk\agent\log\check_mk.log and noticed the following line:
2024-05-14 15:36:02.007 [srv 18224] [Warn ] Process ‘C:\ProgramData\checkmk\agent\plugins\mk_jolokia.py’ has no data
Apparently it detects the script but does not return any data.
We tried running the Python script on the CMD and it seems to work fine, but somehow it is not detected by CheckMK.


I have no idea why it is not detected by CheckMK as the script seems to work.
I also tried copying mk_jolokia.py to the C:\ProgramData\checkmk\agent\local or C:\ProgramData\checkmk\agent\mrpe folders, but that was not the problem.
I also tried to look for a solution on the forum and found a similar problem, but did not find any answers there:
Can someone please help me? I am sure it is a small detail.
