Good morning,
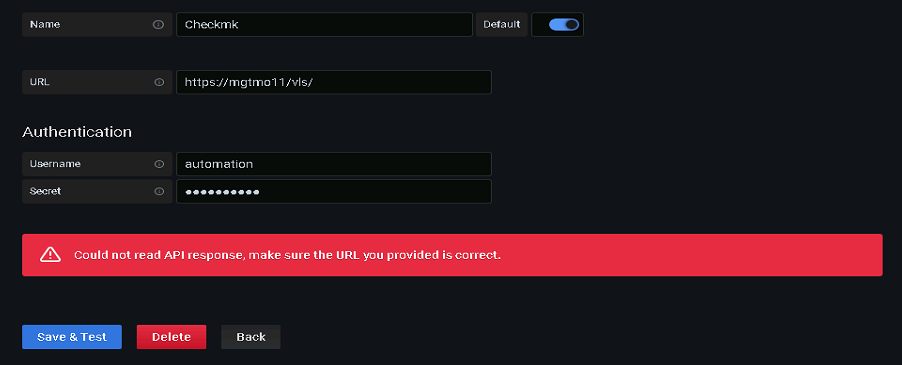
I wanted to test grafana so I rolled out a new VM with SLES 12SP3 and installed the RPM and the datasource it. All went fine until the datasource configuration.
check_mk version: 1.6.0p20 EE
grafana version: 7.4.0
CMK-Server: mgtmo11
CMK-Site: vls
Grafana-Server: mgtmo13
the API call via command line works fine:
mgtmo13:~ # curl “https://mgtmo11/vls/check_mk/webapi.py?action=get_host&_username=automation&_secret=1234512345&output_format=python&request_format=python” -d ‘request={“hostname”:“vls-dbXX”}’
{‘result’: {‘attributes’: {‘alias’: u’DBXX - HX0.0XX’, ‘meta_data’: {‘created_at’: None, ‘created_by’: None}, ‘ipaddress’: ‘172.XX.XX.XXX’, ‘tag_TAG_00005’: ‘00005_02’, ‘parents’: [‘vlshXXX’]}, ‘hostname’: ‘vls-dbXX’, ‘path’: ‘vls/XXX/XXXXXXXX/db’}, ‘result_code’: 0}
mgtmo13:~ #
I’ve tried nearly everything, no firewall is runing on the servers. I even installed grafana on the check_mk server itself (mgtmo11) - same issue.
thanks for helping me, maybe someone has a hint or idea ![]()
Josef