CMK version: 2.4.0p8 enterprise OS version: virtual appliance, on site Plugin: checkmk-cloud-datasource (on Grafana v12.2.0-16895479002)
in CheckMK I collect some data via a custom python script. Part of the data is also the current last ticketnumber “error-id” with the value of 28782579.
If I view the (raw) data in grafana (table view) it shows 28782600. So somewhere in between CheckMK and Grafana the the number is rounded. I did not find a way to avoid this.
Could it be because the number already has an unfavorable variable type in CheckMK? How can I test or change this?
I also tried to retrieve the value directly via the API, but failed because of the format of the API call.
Any ideas to get the exact value of the field into Grafana?
Can you please check if this happens between Grafana and Checkmk or in Checkmk?
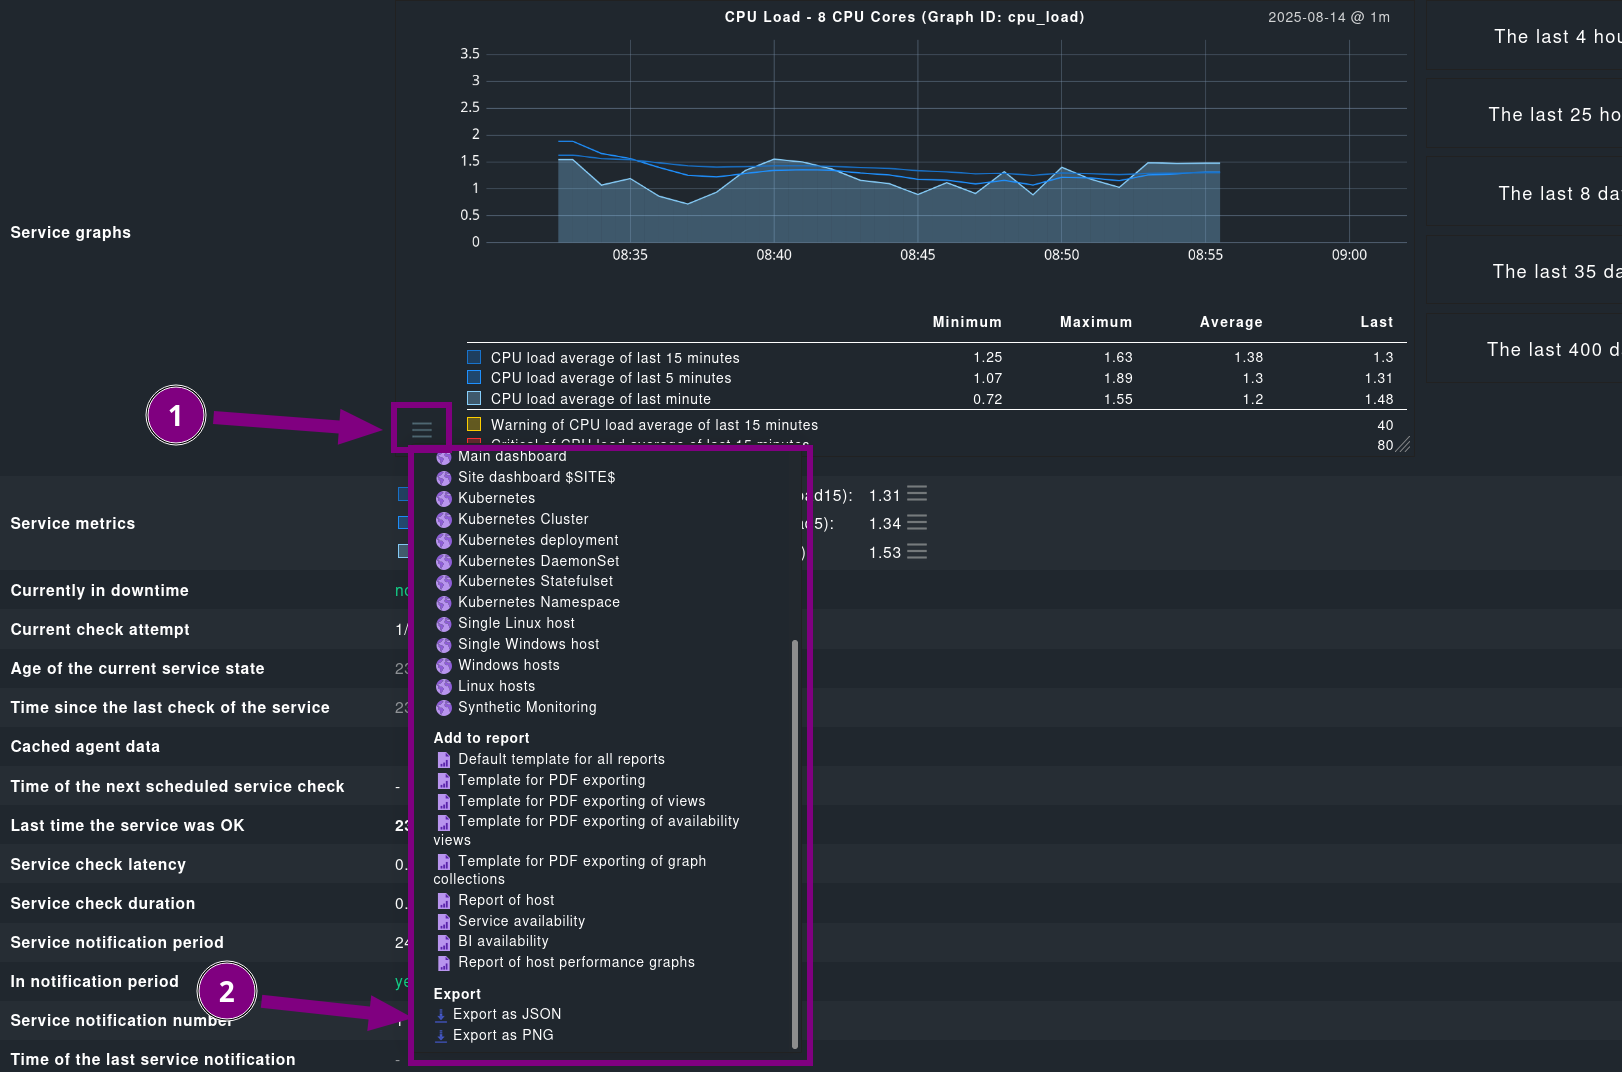
You can view the raw data of a graph via “Export as JSON” in the Graph menu. Please zoom into the new part of the graph, so no raw values getting merged.
I also asked some colleges, and they seem to agree that our metric backend (RRD) is not the place to store integers. There seem to be multiple obstacles that are problematic with that. One of them is the data point merging mentioned above: if you zoom out on the graph, multiple points are merged and their average is calculated. Another problem seems to be that RRD interpolates values to a fixed time steps.
But in the end you can only avoid this behavior with two different approaches.
configure your RRD in a way that it does no normalization and consolidation
i think this is difficult to achieve inside a CMK environment
sent your performance metrics direct to a metric storage like InfluxDB where you can define way easier how the consolidation is done. Normally there is no automatic consolidation like it is done inside the CMK rrd’s.
So I think I am beginning to understand the problem now: The data is correcly reported to CheckMK, but will be saved as a rounded number because of rrd. Thats also why Grafana can only get the rounded values. So there seems not to be a way to just pass a value from the Service Metrics to Grafana. (Service Summery is just “OK” in my case)
Historical we are comming from Icinga and someone implemented it in this way, but I understand that CheckMK is just not to be the right tool for this job.
Thank you for pointing me in the right direction. I will search a for a different approach.
The mentioned livestatus wrapper seems not work with the current version of CheckMK and apache. Any idea how to get livedata into Grafana without an extra storage like InfluxDB?