I tried to use Per process CPU monitoring - #12 by rawiriblundell this and got it working, but i can’t find anywhere any history data.
Say forexample at every night around 22:00pm server warns of criticcal load, we would want to know what process was causing this issue at that time, any recommendations how to get this data in checkmk ?
I’m in
“Monitor > Overview > All hosts > server x > Services of Host > Service > Events of service server x, Top_5_CPU_No.1”
(the one in your picture), but it’s empty ?
Problem is, this service never goes critical, there’s a separate service that monitors overall load (which goes critical when something is wrong), and this one just shows top5 services at any specific moment, but as some other people were thinking, it’s kinda useless data if i can’t look back in history what the service was at that specific moment.
Everyone kept mentioning service history but yeah, if it doesn’t show changes in what services were in top 5 at what moment, then i guess i can remove it and have to figure out another way.
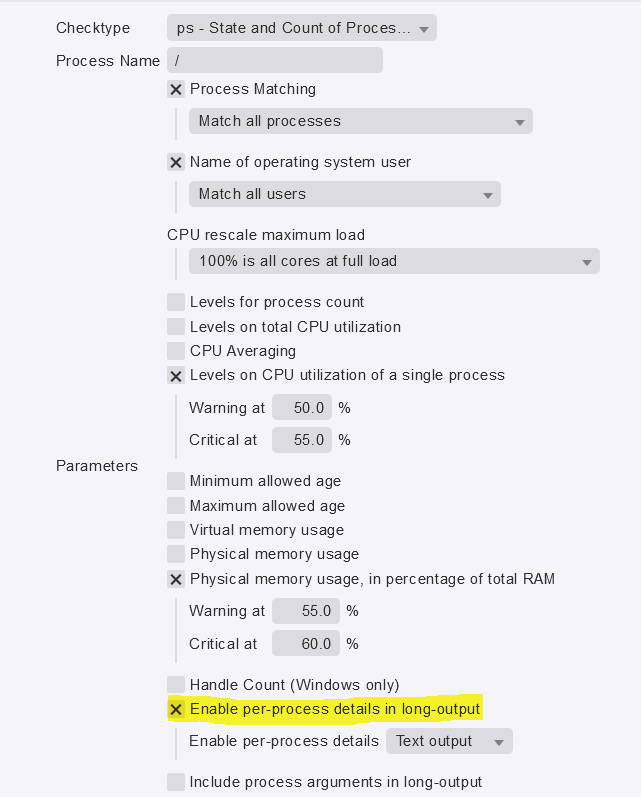
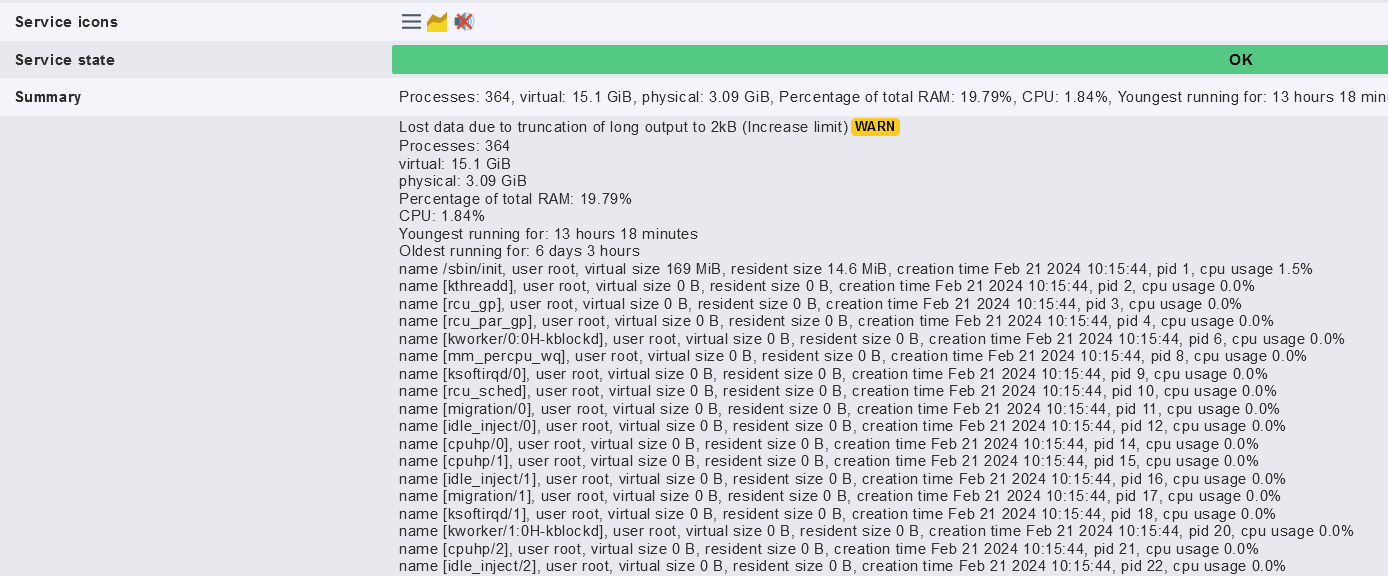
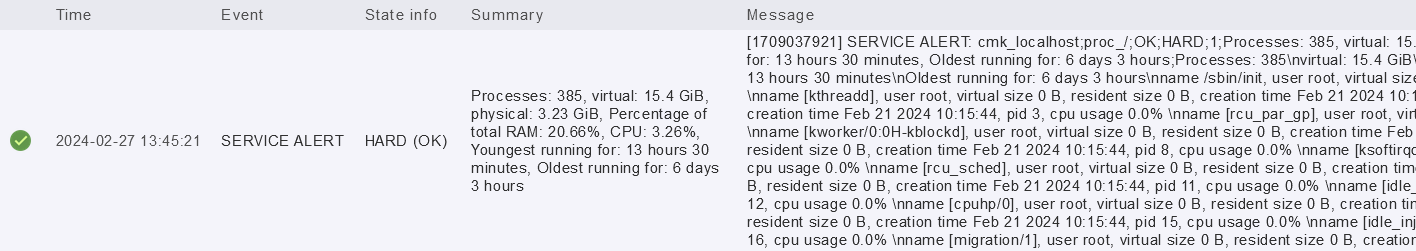
Hello Lilian. Also also had my doubt with the “TOP5 Local Script” as this does not have a useful Service Event History (Tested on 2.1.0 cee)… so i start some researching and maybe found a solution which is “out-of-the-box” to analyse critical loads cause on single servers. Here i created an "Enforced Service → State and count of processes with the below Parameters to get insights of the current running processes. Alerting Thresholds can be edited as needed.
This topic was automatically closed 365 days after the last reply. New replies are no longer allowed. Contact an admin if you think this should be re-opened.