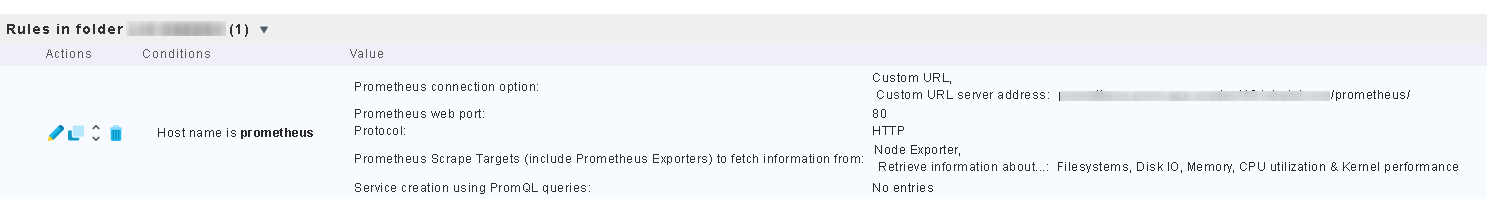
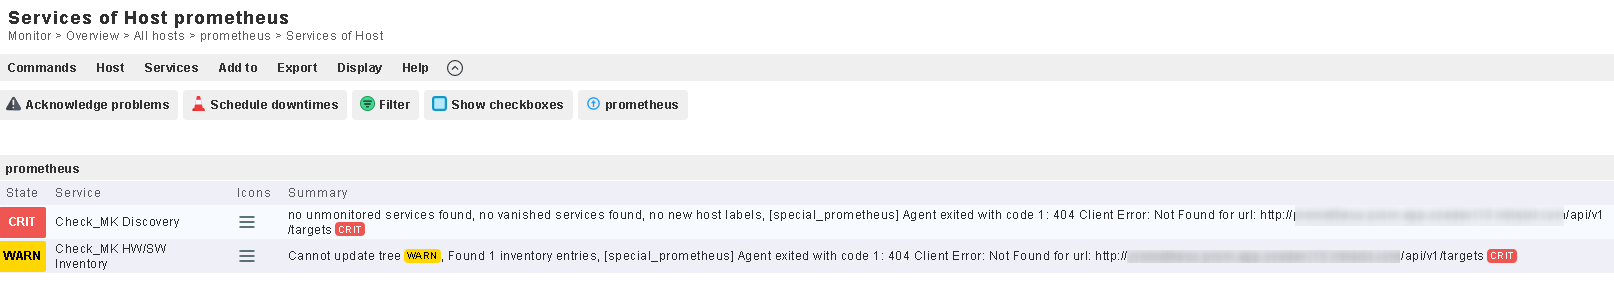
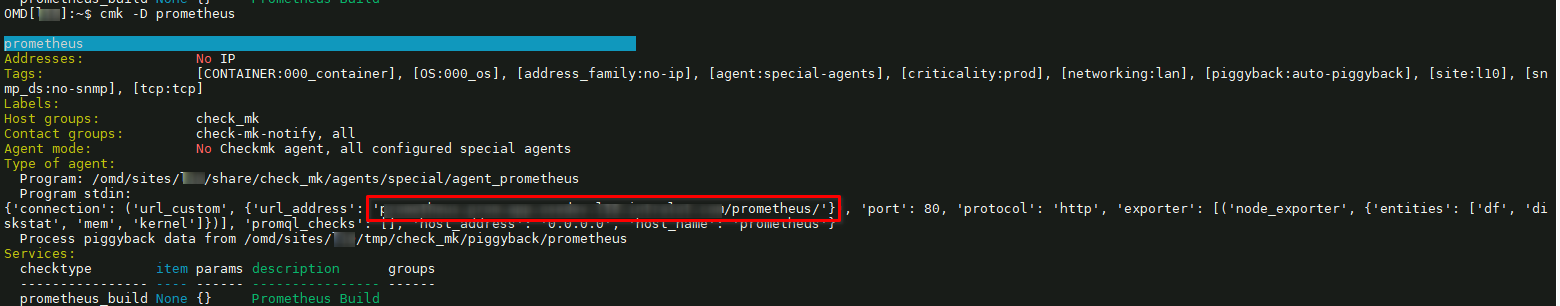
I’m trying to set up Prometheus integration on a CRE in version 2.0.0p17 as per the “Prometheus integrieren” section in the manual, but it looks like the check doesn’t care about my custom URL, and always tries to poll
<BASE_URL> + /api/v1/targets
The URL I need to poll, is formed like this though:
<BASE_URL> + /prometheus/
Because the “targets” are here:
<BASE_URL> + /prometheus/api/v1/targets
I have found similar reports from users wanting to use a custom URL, in those three threads:
Please note, that the user in the first thread, had the issue that there
was no possibility to specify a custom URL to begin with. The second thread
was created by the same user, to inform that this works now, since he can
specify a custom URL. A follow-up posting regarding syntax was created, but
never answered.
How exactly does the custom URL need to be specified, in order to get
this to work? Does anyone have experience with this?
I just wanted to add, that I just tried this on a CEE in version 2.0.0p17 as well,
and I have the same behaviour: The “/prometheus/” part of my URL is being
omitted.
I am starting to believe that this is a bug: I cannot use a custom URL with this check.
Am I doing something wrong?
Does anyone have similar experience?
I have applied the following workaround: I locally installed a prometheus instance
and configured it to federate my other instance.
My rule is now configured against my local instance, where I don’t need a custom URL, since
it’s already in the prometheus configuration as target in /etc/prometheus/prometheus.yml. I get e.g. cadvisor metrics, and have configured a pod and a service.
BTW, upon discovery on my prometheus host, a check was added for “Prometheus Build”, which
fails/crashes with a KeyError exception regarding the version:
Exception KeyError (version)
Traceback
File “/omd/sites/l10/lib/python3/cmk/base/checking.py”, line 581, in get_aggregated_result
result = _aggregate_results(check_function(**kwargs))
File “/omd/sites/l10/lib/python3/cmk/base/checking.py”, line 812, in _aggregate_results
perfdata, results = _consume_and_dispatch_result_types(subresults)
File “/omd/sites/l10/lib/python3/cmk/base/checking.py”, line 856, in _consume_and_dispatch_result_types
for subr in subresults:
File “/omd/sites/l10/lib/python3/cmk/base/api/agent_based/register/check_plugins.py”, line 89, in filtered_generator
for element in generator(*args, **kwargs):
File “/omd/sites/l10/lib/python3/cmk/base/plugins/agent_based/prometheus_build.py”, line 43, in check_prometheus_build
summary=f"Version: {section[‘version’]}",
There is a known issue, preventing this from working, i.e. it’s a bug.
I have two further questions:
Does this still exist for Checkmk 1.6.x? I cannot find the mkp’s anymore that were delivered with feature pack 2 in 2020, I believe.
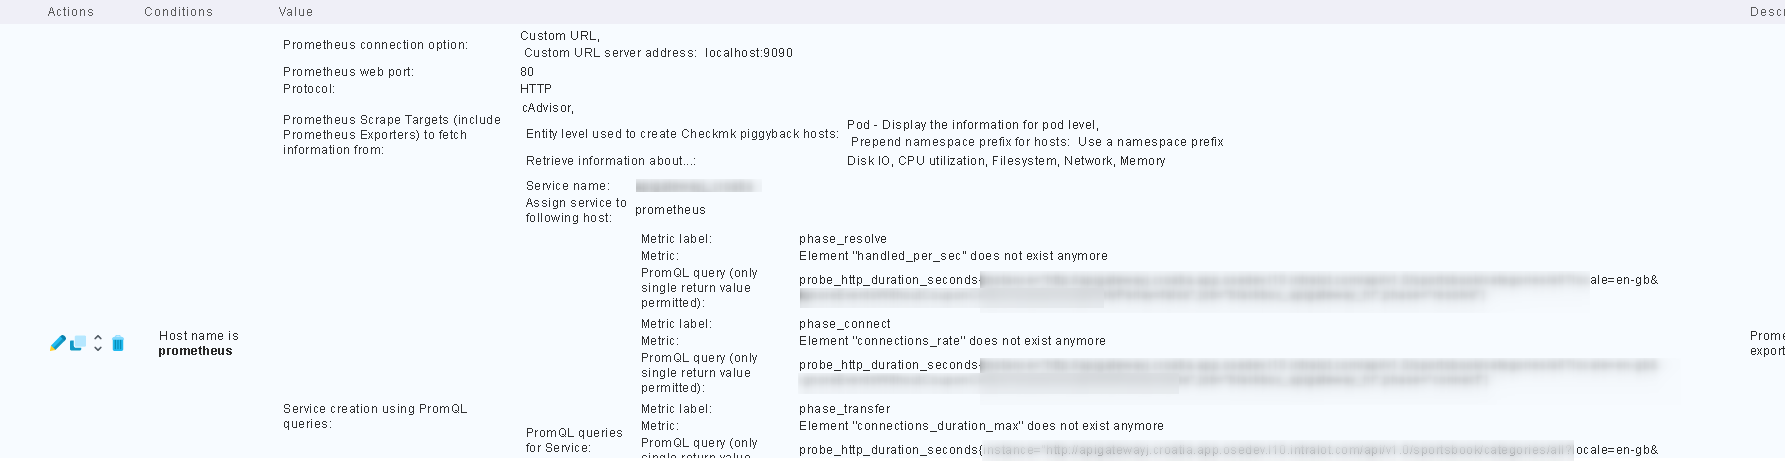
How is the “metrics assignment” supposed to work in a “PromQL” query? This isn’t documented as far as I can see, and I cannot choose the same metric twice, ending up using totally randomly any metric that “might” fit, which btw isn’t labeled with my metric name, but with the one of the metric one selects… and it says something about the “element” not existing anymore. Here is an excerpt:
This topic was automatically closed 365 days after the last reply. New replies are no longer allowed. Contact an admin if you think this should be re-opened.