Hi Robin,
so, I did some testing, here’s the results:
First, I’ve downloaded the agent output installed on the LXC, so that I can get some insight on what’s going on.
This is the section that I’ve found in the output:
<<<lxc_container_cpu_cgroupv2>>>
uptime 60573.54 60573.54
num_cpus 8
usage_usec 179648197122
user_usec 154607125365
system_usec 25041071757
core_sched.force_idle_usec 0
nr_periods 0
nr_throttled 0
throttled_usec 0
nr_bursts 0
burst_usec 0
The number of cpus is correct, and then the part that comes after that is basically the output of /sys/fs/cgroup/cpu.stat
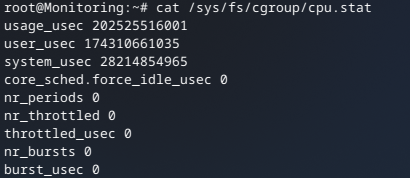
So, it seems like the agent is reporting things correctly.
Next, I’ve made a simple script that converts the usage_usec which represents the total CPU time (in microseconds) consumed by tasks in the cgroup, into a readable percentage.
In order to do that, I simply take 2 samples in a time span (1 second in this case), calculate the delta of the usage and the time, and then use the following formula:
cpu_percentage = (delta_usage / 1000000) / (delta_time * num_cpus) * 100
That’s what it looks like as a script:
#!/bin/bash

# Get the number of CPUs
num_cpus=$(nproc)

# Read the initial usage
usage1=$(cat /sys/fs/cgroup/cpu.stat | grep 'usage_usec' | awk '{print $2}')
time1=$(date +%s)

# Wait 1 second
sleep 1

# Read the second usage
usage2=$(cat /sys/fs/cgroup/cpu.stat | grep 'usage_usec' | awk '{print $2}')
time2=$(date +%s)

# Calculate deltas
delta_usage=$((usage2 - usage1))
delta_time=$((time2 - time1))

# Calculate CPU usage percentage
cpu_usage=$(awk "BEGIN {print ($delta_usage / 1000000) / ($delta_time * $num_cpus) * 100}")

echo "CPU Usage: $cpu_usage%"
Let’s test this out:
It seems like there’s nothing strange with the output of the cpu.stat, the percentage is correctly reported and it matches what I see in real time in Proxmox.
So… let’s dig a little deeper:
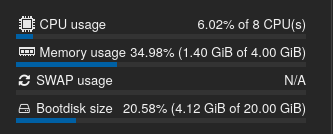
this is the CPU usage on Proxmox:
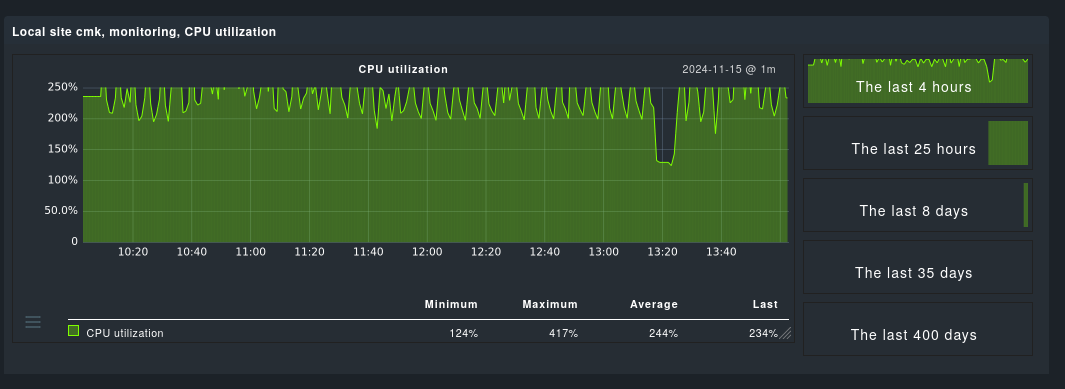
and this is the CPU usage on CheckMK:
There’s a clear pattern that suggests the metrics are somewhat correct, but there is some sort of transformation being applied to it.
I’ve ingested the metrics in Grafana and did some random tests.
Original metric:
Same metric, divided by 8:
Would you look at that, that’s the correct CPU usage 
So what I discovered is that CheckMK is getting the metrics right, but it’s multiplying the actual CPU usage by the amount of cores assigned to the container
Why is CheckMK doing this calculation only to LXC containers? That’s what I’m curious about