Hello,
We have just updated our checkmk environment from 2.1.0p39 to 2.2.0p21 CEE.
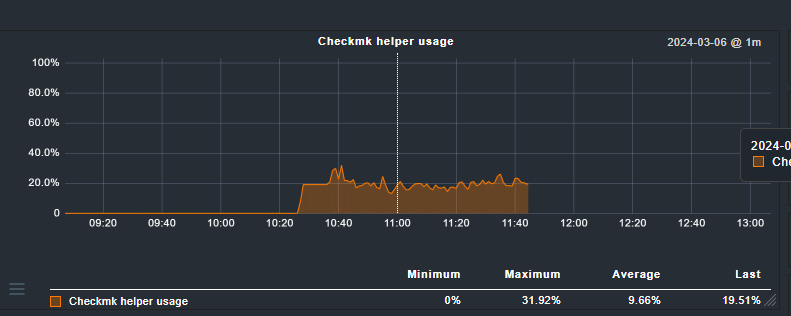
We have now noticed that some graphs in the “OMD performance” service look a bit strange.
The “Checkmk helper usage” went from 0 to >20% shortly after the site update, but then the value was apparently no longer written.
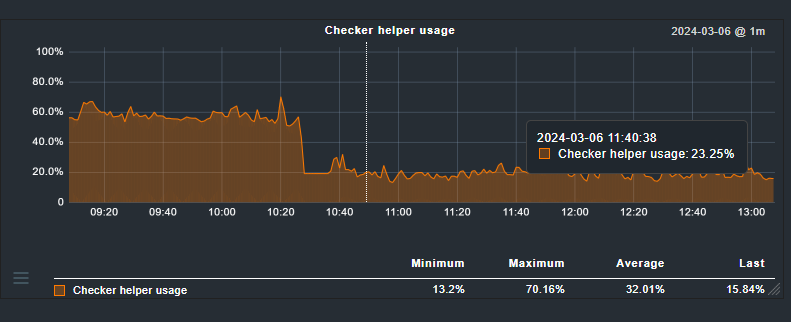
In contrast, the “checker helper usage” decreased by about 20% and continues to be written at the new level.
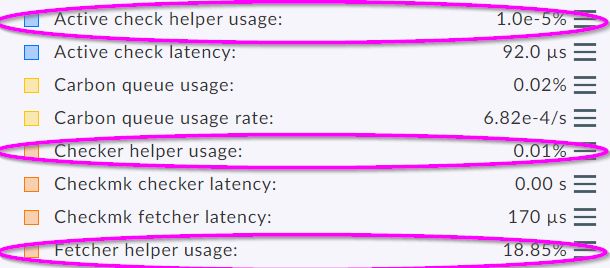
It is more relevant what you see in the check output performance data.
“Checkmk helper usage” should not exist anymore that’s correct in your case.
The screenshot shows the only relevant helper usage values in 2.2
@andreas-doehler
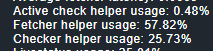
Okay, so with our 8 remote sites the checker helper usage was always easily over 50% until the 2.2 update, with currently 10 checkers and 30 fetchers. We have around 1000 Linux systems, some with DB2 + Oracle DBs. Whenever the helper usage was at 80%, we increased the checkers by 1-2. It’s been like this for over 5 years now.
But anyway, now the usage looks great without us having to do anything