I’m trying to setup real-time checks for mainly CPU and Memory using RRD files with 1sec intervals. I have three problems:
1.) I’m not sure if it works. Is there a way to look at if checkmk receives any correct data? I can use cpdump port 6559 and it looks like I get UD packets but are they valid? Do I need to specify the password somewhere else than the rule that enable real-time checks?
2.) The CPU graphs in Checkmk looks like they are at 1min sampling rate. Is that correct? I would assume the graphs would adjust to the RRD data?
3.) I also have an InfluxDB exporter as It’s easier to see the samples in Influx and connect them to Grafana. Here I also see one time series data every minute (not every second)
I’m also wondering if there is a way to adjust the poller interval for real-time checks? 1s not needed, we are thinking about every 15s instead. is that doable?
My last question is around extra checks, as you can configure that. I’m curios what kind of path I need to use, for example if I want to include Interface bandwidth?
Apparently if your monitored site server and the agent sending real-time alerts don’t have matching clocks (+5 sec) no real time data will be available. This was a test system where NTP was not reachable. Changing that and the real time checks instantly started…
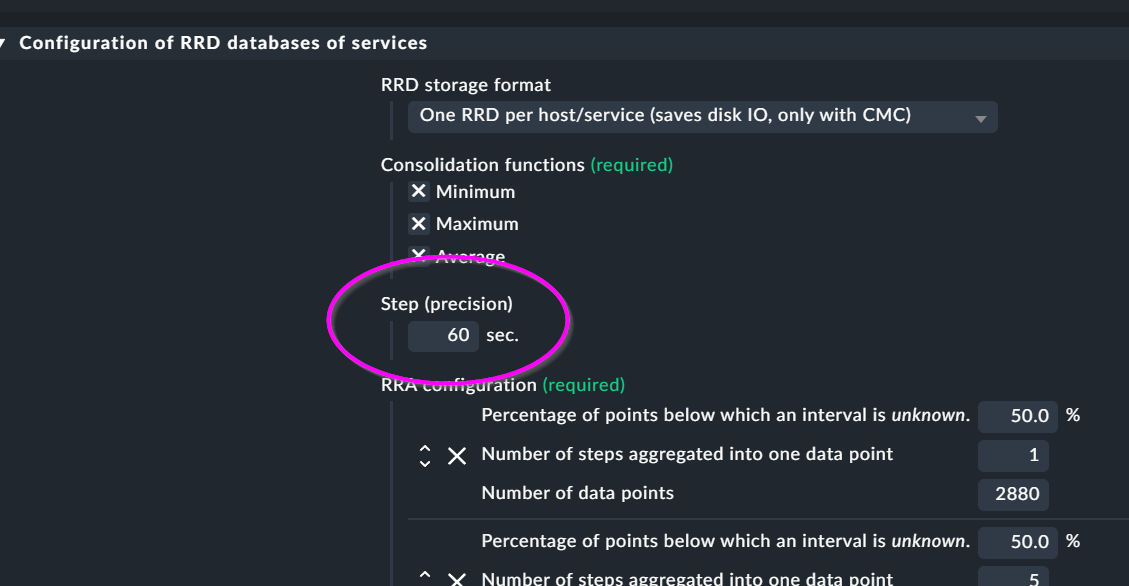
But be aware that this will result in a smaller time range if you leave the amount of data points the same.
10 seconds per step → 2880 data point → only 480 minutes before you have the first consolidation step.
I have followed the guides and created a new rule (and changed the priority) - I also re-generated rrd files and noticed they where changes for the target host.
So I adjusted the precision to 1sec and adjusted the samples according to the Werk.
However it does not look like the precision has changed on the graphs.
This topic was automatically closed 365 days after the last reply. New replies are no longer allowed. Contact an admin if you think this should be re-opened.