Hey guys, I’m posting here in hope someone could offer tips/tricks on nailing down the culprit of an unusual uptick of Load Average on our CheckMK server.
As of 12/5/2020… the server began having high load. I’ve looked at every possible thing I know of, plus stuffs I search on the internet but can’t figure out what may have happened on that day that could have made the server consistently high. Anybody seen such a behavior on their CheckMK server? Thanks!
I should mention that our server is not getting additional actual load. In fact we’re slowly taking load off this server because we’re in the initial phase of migrating to another data center. We’ve begun by powering down VMs that will not migrate and removed them from CheckMK. So that should actually lower the workload. We are building new resources in the other data center but the monitoring part is done by another node local to that site. The distributed monitoring relationship was created several months ago and only recently began to get the extra CPU load.
First some questions.
How many hosts are monitored on this instance and what is your normal service check interval?
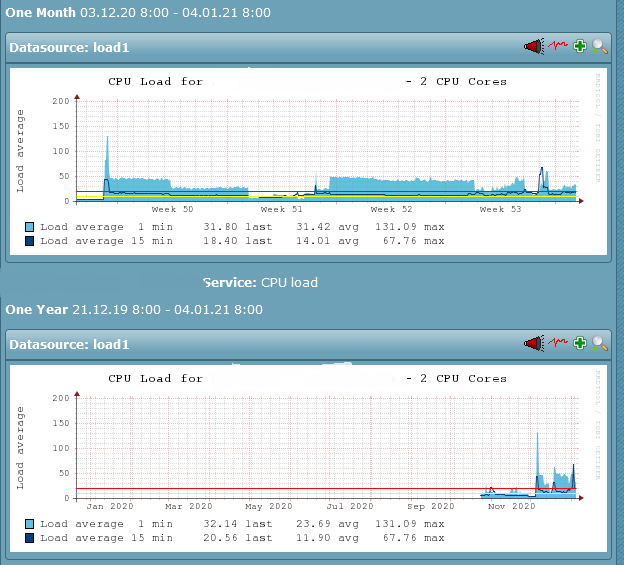
Also in November the load don’t looks good.
It was already between 6 and 10 at this times and this is way to high for a 2 CPU machine.
Without anymore knowledge about your system i would say there are two reasons - too many checks for the 2 CPU and a high impact can be hosts not reachable but with high timeout settings as they block CPU cores in the time waiting.
Second option is some problems with your storage backend. If your system IO is not good you get nice race conditions, as the system is not able to write all performance data to the HDD and already gets more data to write.
The graph looks like the trend began in Nov but when zoomed in, it actually began on Dec 5.
We have 3 sites monitoring 600 hosts total, including VMs, ESXi, some baremetals and URLs.
The work load on this server has always been good. It has never fired off a performance alert for a long time. And as I mentioned recently we’ve only lessen the workload on the number of monitored items by removing hosts from inventory.
Both your specualtions are legitimate. I will investigate both networking and storage for possible leads. Thanks!
Yes but before the graph already shows high values for a 2 CPU core machine.
The warning and critical is way to high with 10 and 20
But why there are no data before November in the graph?
The important information is - how many are on this instance monitored?
You are right! I thought the performance data prior to Nov was too small to be seen… but it fact it’s not there. I’ll need to check why we don’t have historical data. With regards to the threshold, I’m going to power down this VM, give it 2 more cores and a good additional amount of memory to cope with the load.
This is the main prod site, out of the 600 hosts, this site has about 400 of them.
I still haven’t figured out why the historical data prior to Nov is unavailable. I do have data for other hosts/services just not this one.
If an accidental command was run which would have wiped out the historical data on a service, what would that command be? I’m still learning CheckMK on the job I wondering if that could have been the cause.
Although I haven’t figured out why the missing data before Nov, but I did figure out the cause of performance degragation; it’s exactly your speculation: storage performance.
Turns out the datastore that the checkMK VM was sitting on was starting to hit utilization threshold, another member of my team relocated the VM to another datastore which had significantly less thruput. I’ve relocated the VM to a performance datastore and load average has fallen to an acceptable level.
This topic was automatically closed 365 days after the last reply. New replies are no longer allowed. Contact @fayepal if you think this should be re-opened.