I have a problem with a “button” in my check_mk monitoring tool. The problem occurred when one of my colleagues tried to connect two monitoring servers with “distributed monitoring”. I wasn’t there when they did this, so I don’t know exactly what they did, they just told me they got many errors.
After the attempt to connect, they deleted distributed monitoring configuration, but one or more of scripts had been changed and the “button” is not working anymore. I’m getting error too many redirects, without any special code or anything else.
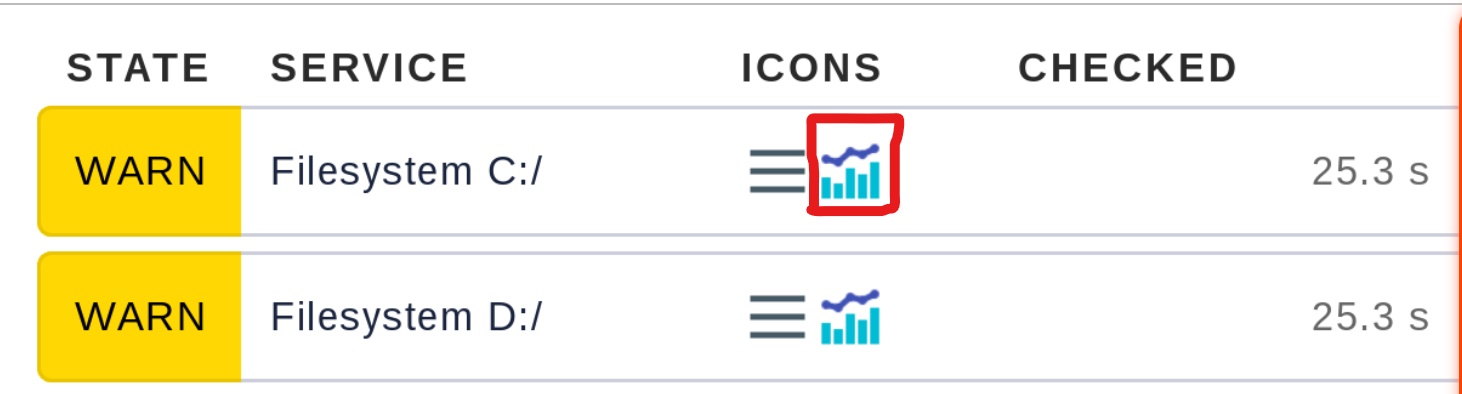
Here is the the photo of exact button marked with red square.
Does anyone know which script check_mk is using for this button, or where to start with investigation.
Error logs in apache shows “I/O bad filedescriptor” and “failed in file object descriptor”. The monitoring core is Nagios, apache web server integrated with check_mk. systemctl status omd shows “working(exited)” status. Everything in check_mk is working just is problem with this “button”.
Are you trying to access graphs from hosts that came from that previous connection ? or it is happening for all the hosts/services that you used to have ?
If you could paste the url that appears when you tried to use the button would be useful. As a first thought it might be trying to redirect you to a non existing instance / website / url.
somehow you ended up in a strange redirection loop, that’s get you to the origin page, I used to get a lot of them when I first started to work with loadbalancers lol .
I would restore a backup earlier that the weird voodoo someone done there
Backup currently is not an option
I’ll install a new server with new check_mk installation, and check everything. It’s probablly wrong path to the icon. The boss has told me just “Finde die richtige Lösung” haha
I had to translate that Well you have other options, if you are going to create a new site try to grep in old and new for the icon and see the differences between output. And try to give a look on apache redirections and check if something is different from a fresh install.
Edit: if possible do a curl -vL to the url and inspect its output, it might give you an idea where the loop is initiating
Still nothing, I’ve tried everything but without sucess.
Prefdata has been created normally, we’re getting notifications with Prefdata graphs, but it won’t work with “button”. I have really no idea what to do
can you paste curl command output ?
I’m trying to understand how can a new connection broke existing stuff in that way.
And if it is possible for you to share how the new connection was made I can keep trying to help


 Well you have other options, if you are going to create a new site try to grep in old and new for the icon and see the differences between output. And try to give a look on apache redirections and check if something is different from a fresh install.