CMK version: 2.1.0p19
OS version:Debian Bullseye (server) Ubuntu 20.10 (host)
Error message: None
Output of “cmk --debug -vvn hostname”:
Checkmk version 2.1.0p19
Try license usage history update.
Trying to acquire lock on /omd/sites/monitoring/var/check_mk/license_usage/next_run
Got lock on /omd/sites/monitoring/var/check_mk/license_usage/next_run
Trying to acquire lock on /omd/sites/monitoring/var/check_mk/license_usage/history.json
Got lock on /omd/sites/monitoring/var/check_mk/license_usage/history.json
Next run time has not been reached yet. Abort.
Releasing lock on /omd/sites/monitoring/var/check_mk/license_usage/history.json
Released lock on /omd/sites/monitoring/var/check_mk/license_usage/history.json
Releasing lock on /omd/sites/monitoring/var/check_mk/license_usage/next_run
Released lock on /omd/sites/monitoring/var/check_mk/license_usage/next_run
+ FETCHING DATA
  Source: SourceType.HOST/FetcherType.TCP
[cpu_tracking] Start [7fc220fccbb0]
[TCPFetcher] Fetch with cache settings: DefaultAgentFileCache(hostname, base_path=/omd/sites/monitoring/tmp/check_mk/cache, max_age=MaxAge(checking=0, discovery=120, inventory=120), disabled=False, use_outdated=False, simulation=False)
Not using cache (Too old. Age is 15 sec, allowed is 0 sec)
[TCPFetcher] Execute data source
Connecting via TCP to ip_of_hostname:6556 (5.0s timeout)
Detected transport protocol: TransportProtocol.TLS (b'16')
Reading data from agent via TLS socket
Reading data from agent
Detected transport protocol: TransportProtocol.PLAIN (b'<<')
Write data to cache file /omd/sites/monitoring/tmp/check_mk/cache/hostname
Trying to acquire lock on /omd/sites/monitoring/tmp/check_mk/cache/hostname
Got lock on /omd/sites/monitoring/tmp/check_mk/cache/hostname
Releasing lock on /omd/sites/monitoring/tmp/check_mk/cache/hostname
Released lock on /omd/sites/monitoring/tmp/check_mk/cache/hostname
Closing TCP connection to ip_of_hostname:6556
[cpu_tracking] Stop [7fc220fccbb0 - Snapshot(process=posix.times_result(user=0.0, system=0.0, children_user=0.0, children_system=0.0, elapsed=0.7900000028312206))]
  Source: SourceType.HOST/FetcherType.PIGGYBACK
[cpu_tracking] Start [7fc220f67040]
[PiggybackFetcher] Fetch with cache settings: NoCache(hostname, base_path=/omd/sites/monitoring/tmp/check_mk/data_source_cache/piggyback, max_age=MaxAge(checking=0, discovery=120, inventory=120), disabled=True, use_outdated=False, simulation=False)
Not using cache (Cache usage disabled)
[PiggybackFetcher] Execute data source
No piggyback files for 'hostname'. Skip processing.
No piggyback files for 'ip_of_hostname'. Skip processing.
Not using cache (Cache usage disabled)
[cpu_tracking] Stop [7fc220f67040 - Snapshot(process=posix.times_result(user=0.0, system=0.0, children_user=0.0, children_system=0.0, elapsed=0.009999997913837433))]
+ PARSE FETCHER RESULTS
  Source: SourceType.HOST/FetcherType.TCP
<<<check_mk>>> / Transition NOOPParser -> HostSectionParser
<<<cmk_agent_ctl_status:sep(0)>>> / Transition HostSectionParser -> HostSectionParser
<<<checkmk_agent_plugins_lnx:sep(0)>>> / Transition HostSectionParser -> HostSectionParser
<<<labels:sep(0)>>> / Transition HostSectionParser -> HostSectionParser
<<<df>>> / Transition HostSectionParser -> HostSectionParser
<<<df>>> / Transition HostSectionParser -> HostSectionParser
<<<systemd_units>>> / Transition HostSectionParser -> HostSectionParser
<<<nfsmounts>>> / Transition HostSectionParser -> HostSectionParser
<<<cifsmounts>>> / Transition HostSectionParser -> HostSectionParser
<<<mounts>>> / Transition HostSectionParser -> HostSectionParser
<<<ps_lnx>>> / Transition HostSectionParser -> HostSectionParser
<<<mem>>> / Transition HostSectionParser -> HostSectionParser
<<<cpu>>> / Transition HostSectionParser -> HostSectionParser
<<<uptime>>> / Transition HostSectionParser -> HostSectionParser
<<<lnx_if>>> / Transition HostSectionParser -> HostSectionParser
<<<lnx_if:sep(58)>>> / Transition HostSectionParser -> HostSectionParser
<<<tcp_conn_stats>>> / Transition HostSectionParser -> HostSectionParser
<<<diskstat>>> / Transition HostSectionParser -> HostSectionParser
<<<kernel>>> / Transition HostSectionParser -> HostSectionParser
<<<md>>> / Transition HostSectionParser -> HostSectionParser
<<<vbox_guest>>> / Transition HostSectionParser -> HostSectionParser
<<<job>>> / Transition HostSectionParser -> HostSectionParser
<<<timesyncd>>> / Transition HostSectionParser -> HostSectionParser
<<<timesyncd_ntpmessage:sep(10)>>> / Transition HostSectionParser -> HostSectionParser
<<<local:sep(0)>>> / Transition HostSectionParser -> HostSectionParser
<<<postgres_instances>>> / Transition HostSectionParser -> HostSectionParser
<<<postgres_stat_database:sep(59)>>> / Transition HostSectionParser -> HostSectionParser
<<<postgres_version:sep(1)>>> / Transition HostSectionParser -> HostSectionParser
<<<postgres_conn_time>>> / Transition HostSectionParser -> HostSectionParser
<<<nginx_status>>> / Transition HostSectionParser -> HostSectionParser
<<<check_mk:cached(1673443325,3600)>>> / Transition HostSectionParser -> HostSectionParser
No persisted sections
  -> Add sections: ['check_mk', 'checkmk_agent_plugins_lnx', 'cifsmounts', 'cmk_agent_ctl_status', 'cpu', 'df', 'diskstat', 'job', 'kernel', 'labels', 'lnx_if', 'local', 'md', 'mem', 'mounts', 'nfsmounts', 'nginx_status', 'postgres_conn_time', 'postgres_instances', 'postgres_stat_database', 'postgres_version', 'ps_lnx', 'systemd_units', 'tcp_conn_stats', 'timesyncd', 'timesyncd_ntpmessage', 'uptime', 'vbox_guest']
  Source: SourceType.HOST/FetcherType.PIGGYBACK
No persisted sections
  -> Add sections: []
Received no piggyback data
Received no piggyback data
[cpu_tracking] Start [7fc220f2f2b0]
value store: synchronizing
Trying to acquire lock on /omd/sites/monitoring/tmp/check_mk/counters/hostname
Got lock on /omd/sites/monitoring/tmp/check_mk/counters/hostname
value store: loading from disk
Releasing lock on /omd/sites/monitoring/tmp/check_mk/counters/hostname
Released lock on /omd/sites/monitoring/tmp/check_mk/counters/hostname
CPU load             15 min load: 0.11, 15 min load per core: 0.01 (12 cores)
CPU utilization      Total CPU: 0.75%
Check_MK Agent       Version: 2.1.0p19, OS: linux, Last update: Jan 11 2023 13:22:02, Agent plugins: 6, Local checks: 0
Disk IO SUMMARY      Read: 0.00 B/s, Write: 20.5 kB/s, Latency: 6 milliseconds
Filesystem /         10.45% used (45.61 of 436.34 GB), trend: +77.49 MB / 24 hours
Filesystem /boot     52.54% used (255.81 of 486.85 MB), trend: 0.00 B / 24 hours
Interface 2          [enp7s0], (up), MAC: 7C:10:C9:1D:51:A1, Speed: 1 GBit/s, In: 603 B/s (<0.01%), Out: 5.60 kB/s (<0.01%)
Kernel Performance   Process Creations: 12.00/s, Context Switches: 1771.19/s, Major Page Faults: 0.00/s, Page Swap in: 0.00/s, Page Swap Out: 0.00/s
MD Softraid md0      Status: active, Spare: 0, Failed: 0, Active: 2, Status: 2/2, UU
MD Softraid md1      Status: active, Spare: 0, Failed: 0, Active: 2, Status: 2/2, UU
MD Softraid md2      Status: active, Spare: 0, Failed: 0, Active: 2, Status: 2/2, UU
Memory               Total virtual memory: 20.07% - 19.22 GB of 95.75 GB, 9 additional details available
Mount options of /   Mount options exactly as expected
Mount options of /boot Mount options exactly as expected
Number of threads    556, Usage: 0.11%
PostgreSQL Connection Time MAIN 0.001 seconds
Systemd Service Summary Total: 115, Disabled: 1, Failed: 0
Systemd Timesyncd Time Offset: 179 microseconds, Time since last sync: 32 minutes 51 seconds, Time since last NTPMessage: 32 minutes 51 seconds, Stratum: 2.00, Jitter: 119 microseconds, Synchronized on 2a01:4f8:0:a112::2:2
TCP Connections      Established: 185
Uptime               Up since Feb 03 2022 14:26:09, Uptime: 342 days 0 hours
No piggyback files for 'hostname'. Skip processing.
No piggyback files for 'ip_of_hostname'. Skip processing.
[cpu_tracking] Stop [7fc220f2f2b0 - Snapshot(process=posix.times_result(user=0.030000000000000027, system=0.0, children_user=0.0, children_system=0.0, elapsed=0.03999999910593033))]
[agent] Success, execution time 0.8 sec | execution_time=0.840 user_time=0.030 system_time=0.000 children_user_time=0.000 children_system_time=0.000 cmk_time_agent=0.800
Hello Everyone,
pretty new to checkmk, especially when it comes to custom Agents.
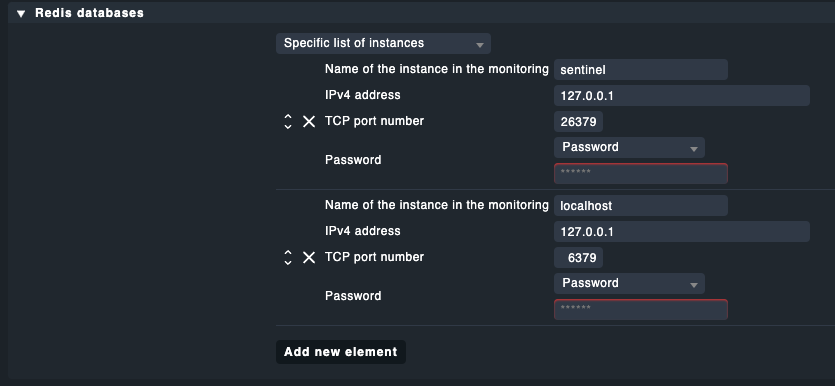
What I did: Set a rule in the Setup - Agents - Windows etc. menu to include Redis. I added that it should only be applied to a specific list of instances (the one I got the above output from), added the port and password for redis.
Then I build (bake) the agent and deployed it to the host, which didn’t bring up any error, same for connecting it to the monitoring site and enabling automatic updates (I added the rule and applied all the steps according to the docs, all checkmarks are green.). I can also see that the host is connected and checked for updates in the last 65 Minutes.
But Redis does not show up at all in the service discovery. So I checked the host and the redis plugin mk_redis is present in /lib/check_mk_agent/plugins/, as well as the mk_redis.cfg in /etc/check_mk/. The mk_redis.cfg contains those entries:
REDIS_HOST_hostname='127.0.0.1'
REDIS_PORT_hostname='6379'
REDIS_PASSWORD_hostname='redis_password'
REDIS_INSTANCES=(hostname)
My understanding is that I should be able to see whatever the redis plugin is gathering, right? I’m out of ideas about what to try or check, I’m sure it’s probably down to some kind of config error, but doublechecking the docs didn’t bring up anything.
Sidenode: I did try it first with checkmk version 2.1.0p14 without success, only just updated to p19 before noticing it is a build released just a few hours ago.
Edit: Today I tried to add MySQL Monitoring to the same Host and it worked as expected, even deployed itself via automatic update. Just wanted to add this, as it appears my config isn’t completely wrong at least ![]()
Thank you in advance for any pointers!