Our developer team is glad to introduce the Stable 3.0 Version of the Grafana Plugin. You could have read about most of the changes before, when the Beta version was released.
The final list of changes is:
Highlights
Add support for REST API endpoints of Checkmk 2.2.0
Many UI improvements:
Clearer layout for both the RAW and CEE Query Editor
RAW filters are now displayed vertically aligned
The filter type of existing filters can no longer be changed, they have
to be removed, and another filter can be added.
Errors in the Query Editor Fields are more prominently featured in the
inputs themselves
Graphs in Grafana now show the same color as in Checkmk
(Breaking) Changes
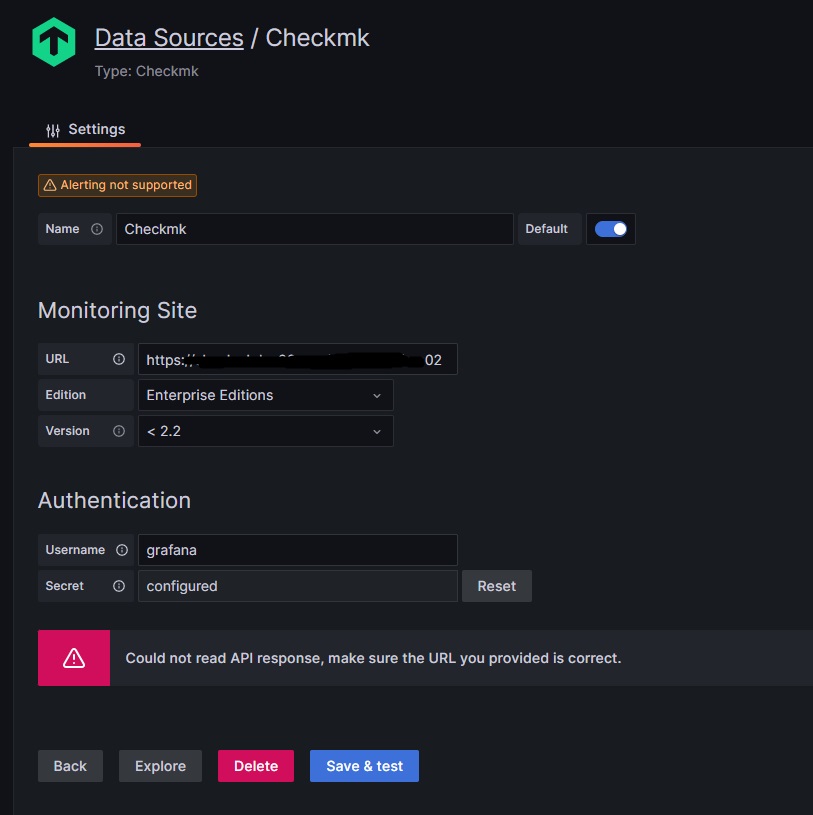
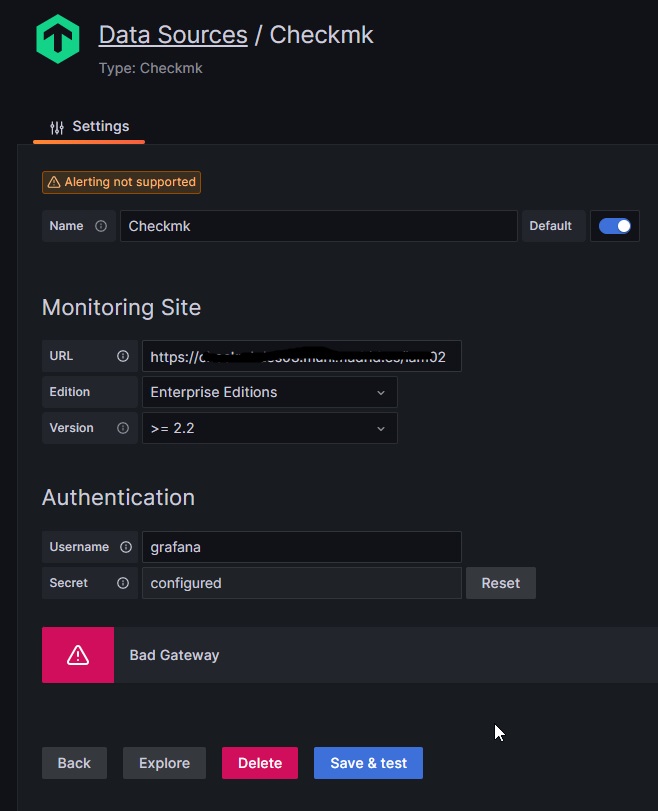
When using Checkmk < 2.2.0 you will have to choose the correct version in the
data source settings, as this defaults to “>= 2.2”
Graph Types have been renamed, existing configuration is not affect by this.
“Template” Graphs are now called “Predefined Graphs”
“Metric” Graphs are now called “Single Metric”
The stable version of the plugin is already available on GitHub.
As before, if you notice any bugs, please report them directly on GitHub
Hi, I have installed the pluging and when configuring it I get an error and the error changes depending on the version I choose, is this normal or is there some data missing? The version of checkMk we have is 2.1.0p24 and the version of Grafana is 9.4.7. Best regards and thanks
Please check the grafana log. Both errors probably have the same origin: You checkmk instance is not reachable from grafana.
Are you using a self-signed certificate? You need to add this certificate to your system CA certificates.
Works well for me. Finally I can use regex to add many services or hosts. One thing I am missing is the state. I know I have asked this before and I know that the state is not part of the agent output but it would be nice to be able to visulize if a host is UP/DOWN in Grafana. I am able to see this in CMK after all.
We discussed this in the past, but currently we don’t plan to implement this. As far as I remember the problem is, that checkmk only knows the current state of the host, but does not record the state of the host/service as it does for the metrics. Basically the grafana plugin can only show metric information.
Hello, I tried to make a connection with both version 3 and version 2 in Grafana 9.4.7 and without certified connection ie without https and does not work in either, I detail the problem.
Again I say it is on Grafana 9.4.7.
For the version tribe-29-checkmk-datasource-2.0.2.zip this happens.
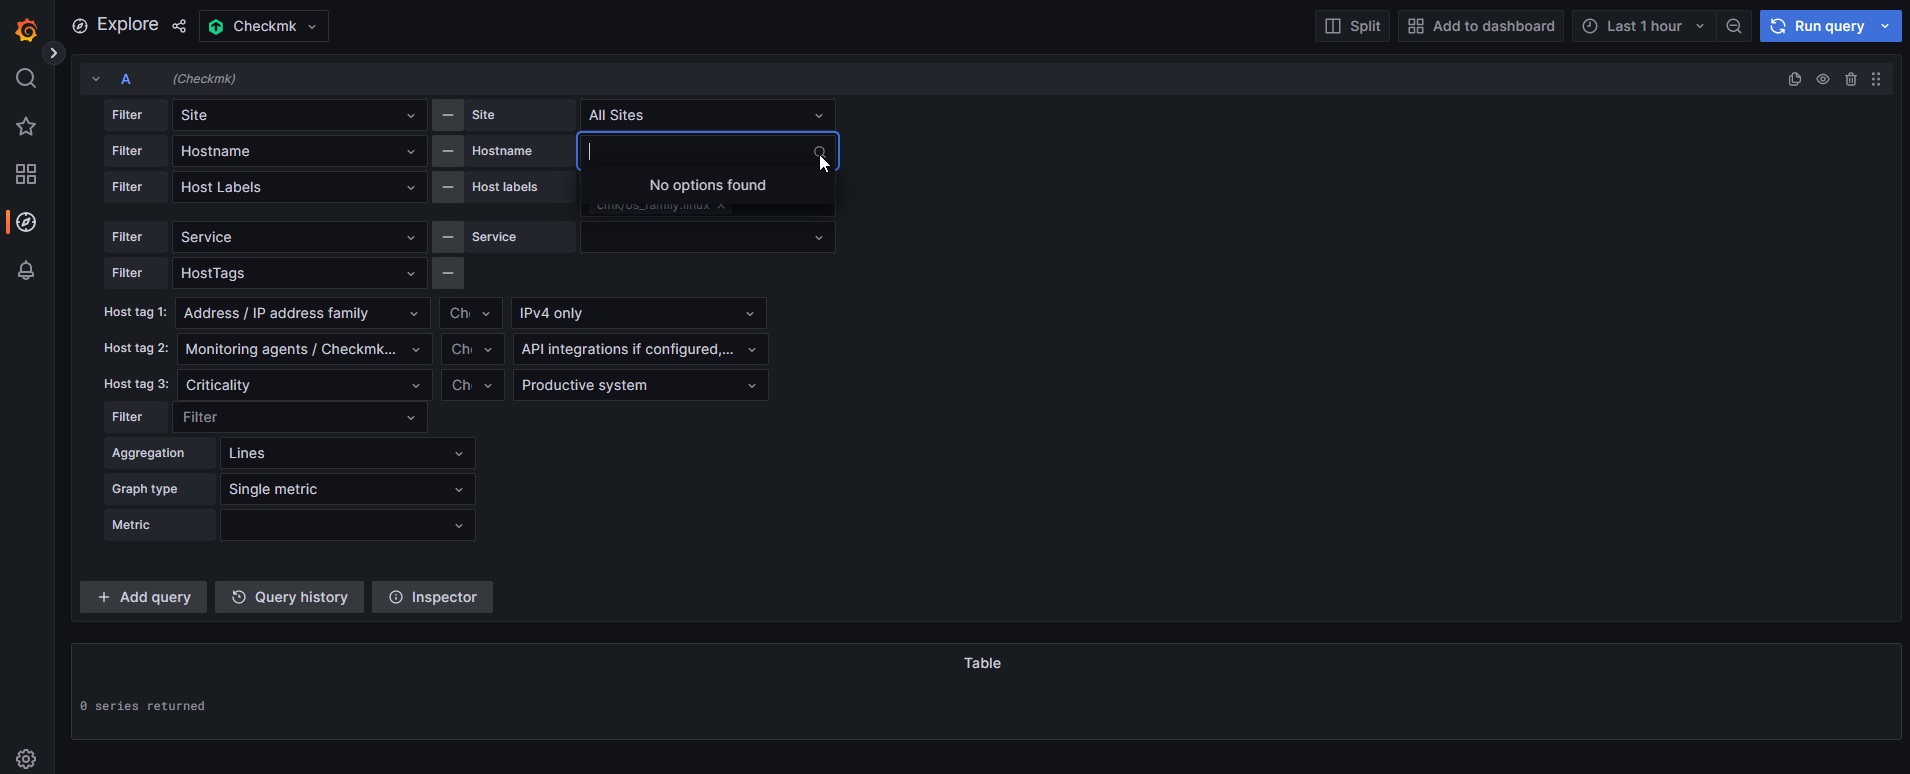
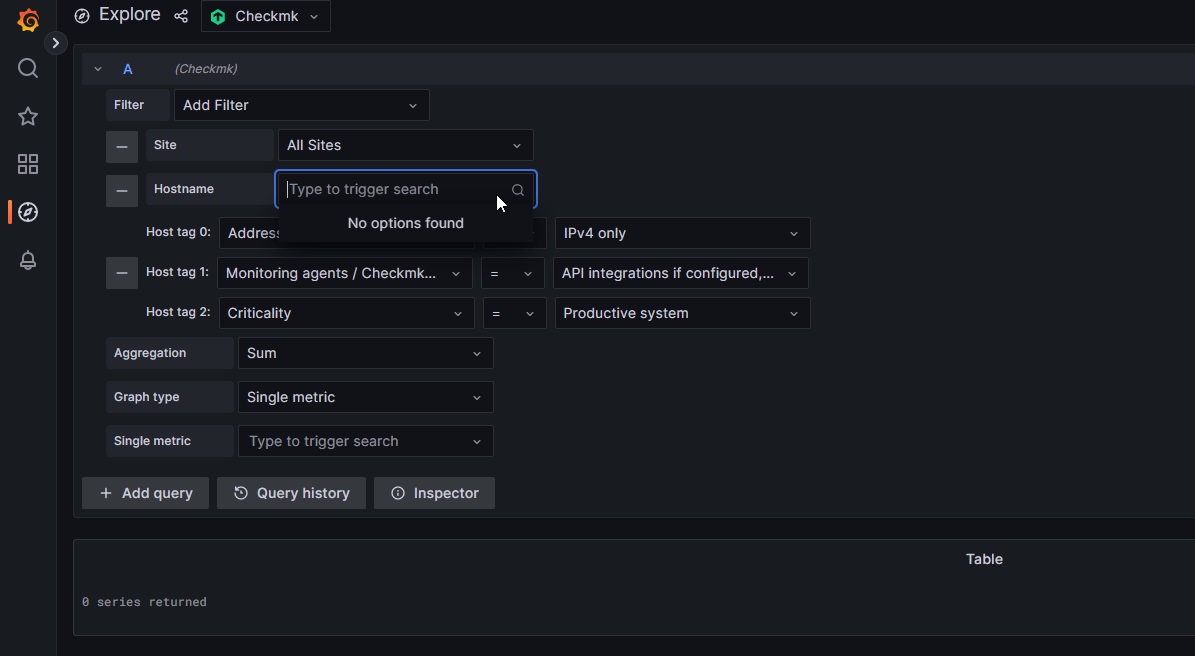
It allows the connection without problem but when making queries it is not able to find the host data, I attach a screenshot.
For the version tribe-29-checkmk-datasource-3.0.0.zip this happens, it establishes the connection but it is not able to find the hosts either, I attach a screenshot.
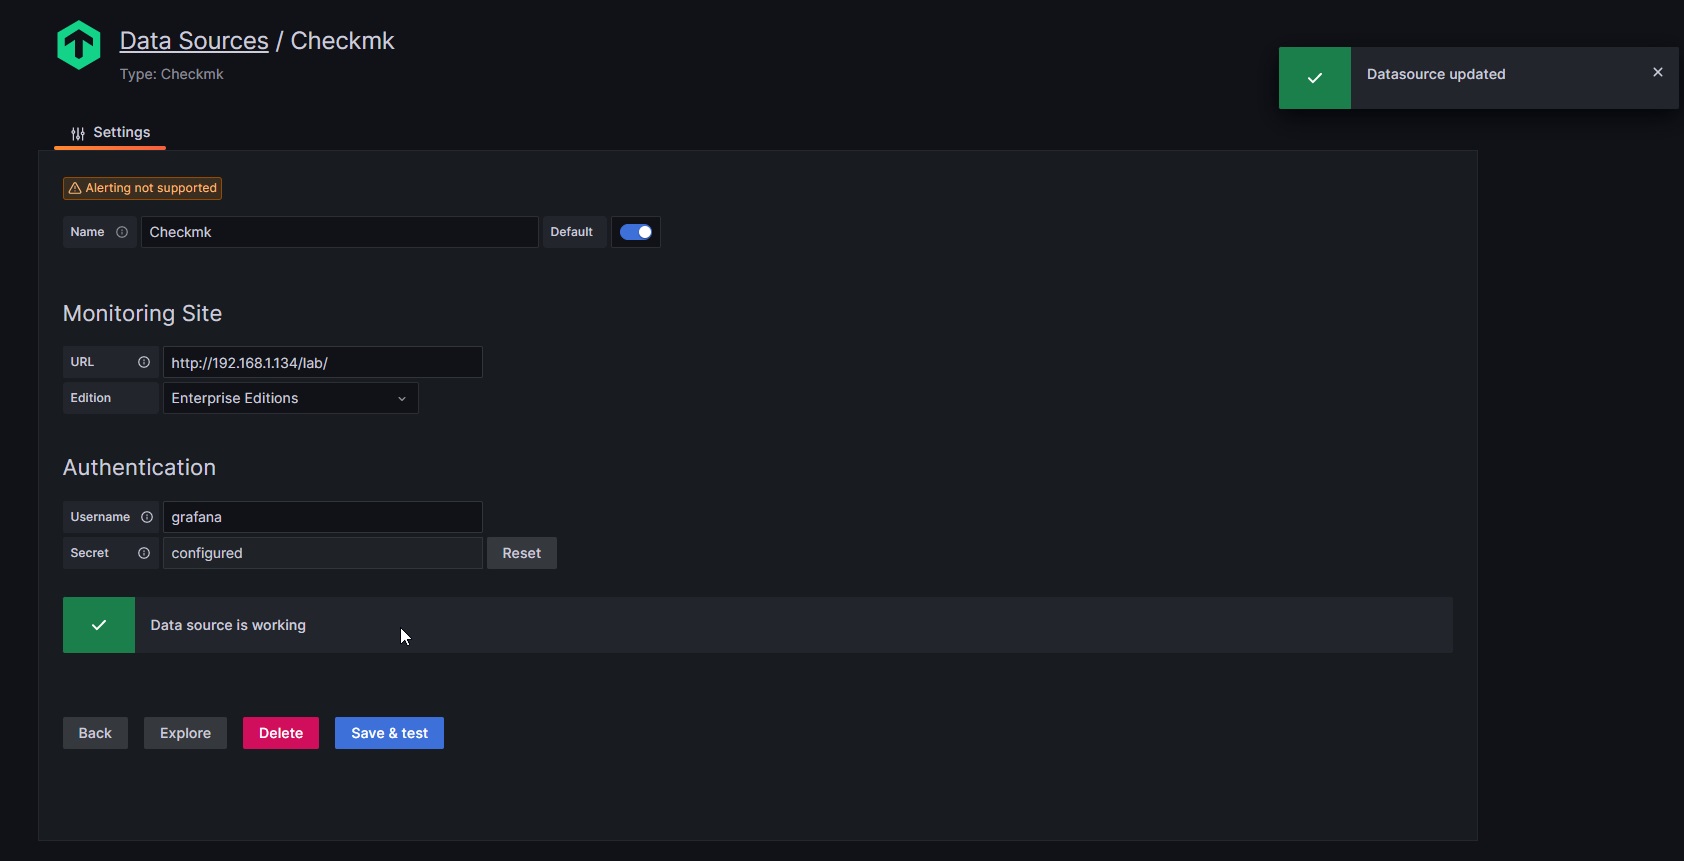
Hello, I have already seen my error, it is the role of the Grafana user that must be the same as the automation one, I just read it from another user that you have posted here in his answer and now it works, thank you very much. All the best