I’m looking to build a report of the amount of critical alerts on a monthly basis.
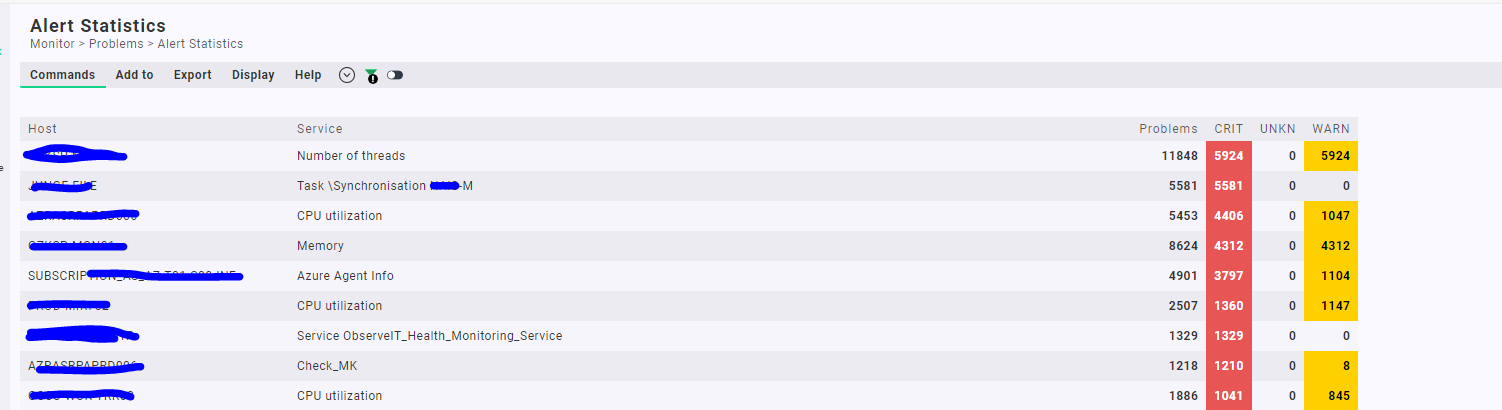
I had a look at the alert statistics and filtering this but I don’t understand why there are so many alerts, the top one for example is a task that has been in critical alert but why is it reporting so high and not one critical alert that stays?
How can I remove this duplication? I acknowledged this alert for example but it keeps coming back into the alert dashboard.
I would like to create a simple report that says the number of devices reported a critical alert in May
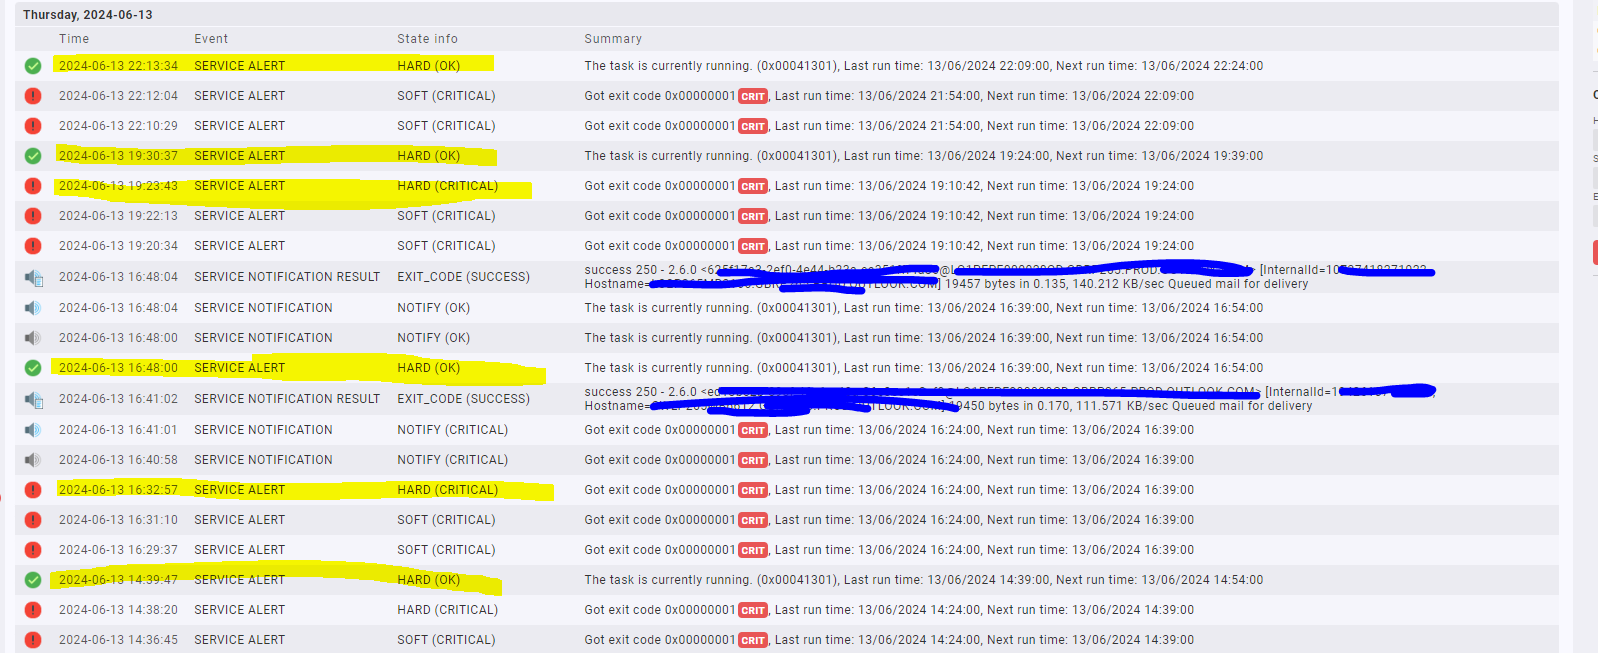
When a task that alerts as critical is acknowledged and keeps coming back into the main hosts and problems page, is this because the task went back to OK and then back to CRITICAL regularly? This is only what I can presume is happening.
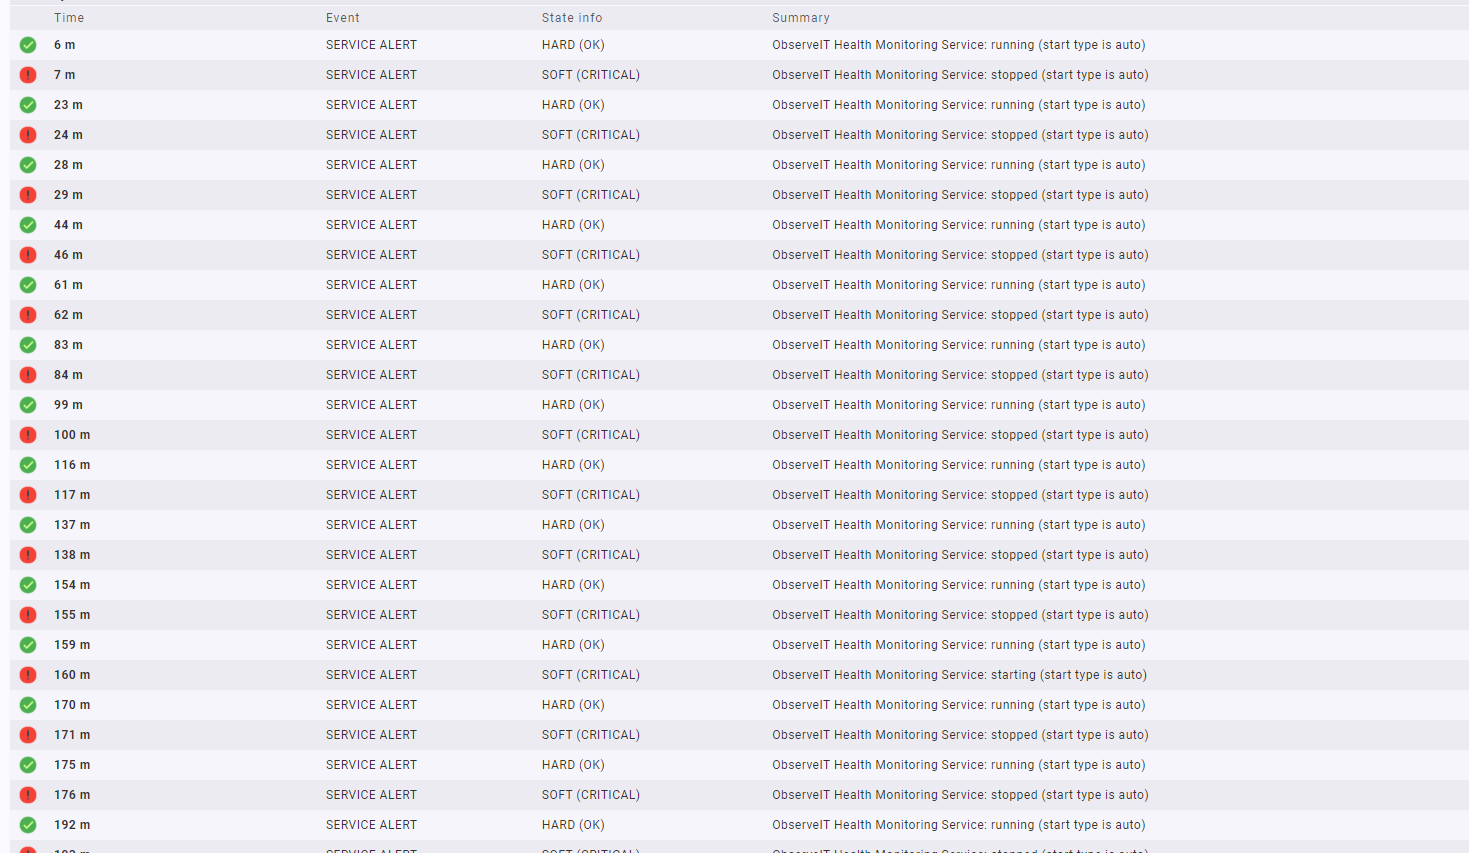
Does the alert statistics view show SOFT Critical Alert states and if so how can I change this to only show HARD states?
I went into one of the services with a high number of alerts over the last 5 days and all the states of it show SOFT. Example below:
I have configured however number of check attempts to be 3 ![]()

1 Like
Also as a secondary question (I don’t think it’s possible) but can we ignore when a task is running which changes it back to an OK state? As this is why there appears to be so many generated critical alerts for a task that keeps running and coming back with the same error:
1 Like
This topic was automatically closed 365 days after the last reply. New replies are no longer allowed. Contact an admin if you think this should be re-opened.