Hi, is it possible to limit a report range from a specific date but also only return uptime between the hours of 9-5pm?
I can’t find the option for this, I was also looking to include the time periods but can’t find this option either.
Hi, is it possible to limit a report range from a specific date but also only return uptime between the hours of 9-5pm?
I can’t find the option for this, I was also looking to include the time periods but can’t find this option either.
See this I presume is literally from 9am on the first day and then 5pm on the final day, but NOT 9-5pm only every day.
I have raw, so no (experience with) reports functionality.
Quickly reading docs, I assume that you can make a custom template with macros.
This is probably what is used in the GUI:
$FROM$			Report start date and time
$UNTIL$			End date and time of the report
But these macros also exist:
$FROM_DATE$		Start date of the report
$UNTIL_DATE$	End date of the report

$FROM_TIME$		Report start time
$UNTIL_TIME$	Report end time
So maybe you can nest above macros to get the result you are after.
More macros for reporting:
I wasn’t fully awake yet, macros only display previously set values.
The existence of those macros, makes me think time and date values can be set separately somewhere in GUI or otherwise, but I can’t find any clues in my raw environment. And the docs isn’t clear about this either, other than macros can be used in text (page or content) elements in a report to show values.
EDIT:
Or maybe it was wishful thinking from my end, and are those extra macros to show only the date or time part of the combined date time entries from the GUI.
Yes documentation isn’t great and I can’t find a way to do this. Maybe through the use of the API but I also can’t see how this can be done here either.
It’s unfortunate we don’t have this option in the checkmk GUI when creating reports.

I was wondering if we set a time period and assigned it to those hosts and then used this option to base report only on service times would this work?
But when what would happen if I applied that time period to those hosts, I don’t want to limit alerts or notifications to that time period either.
But I can’t see how this would work as I would need to assign a time period to the hosts check time or something which I don’t want to do either.
Not having reports in raw, when I want to report complex stuff, I just export the data and do the filtering in external spreadsheet. But then I don’t have any fancy graphs that Checkmk can show.
But how can I export and filter this? I can’t see an option to export the report to CSV, and is there times underneath where I could apply a python snippet to?
I use (custom) view(s) to export data, and in a view there’s a default option to export to csv or json. Or alternatively, sometimes use a browser add-on that can capture tables.
With views that show date & time, for example downtime history, I make sure the display > modify display options don’t have mixed, relative or both format set.

Yes I was looking at views but I don’t think this will work as I need a view to show Networking equipment up, down and scheduled downtime with the average % for the last 3 months between 9-5pm as an example and a summary average overall.
Quick break down how I would probably approach it in raw:
Networking equipment up, down: (customized) view of Host & service history of last 3 months
scheduled downtime: (customized) view of Downtime history of last 3 months
export data to csv with generic name,
so you can easy replace csv’s with new exports in future without breaking logic in file name
csv import in excel
new export csv files, refresh in excel to get new data
alternatively to above 2 points: link web in excel directly from checkmk, but I wasn’t able to get authentication working in the past
filter data based on times between 9:00 - 17:00
currently not sure how to deal with issues like down(time) starting before 9:00 and / or ending after 17:00
average statistics as calculated columns
might indeed be a bit of work to get that done.
so fingers crossed someone else has a better solution directly working in Checkmk reporting.
@mgillespie1981
Service periods are exactly what you’re looking for. Quoting the inline help:
When it comes to availability reporting, you might want the report to cover only certain time periods, e.g. only Monday to Friday from 8:00 to 17:00. You can do this by specifying a service period for hosts or services. In the reporting you can then decide to include, exclude or ignore such periods und thus e.g. create a report of the availability just within or without these times. Note: Changes in the actual definition of a time period will only be reflected in times after that change. Selecting a different service period will also be reflected in the past.
the service period is not used anywhere except for availability reporting, so it has no affect on views, alerts etc.
I tried setting this up but the report doesn’t reflect it?

I guess the question is how do I know if it’s filtering the report by this or not? It doesn’t say so at the top.
![]()
easiest way to be sure and see exactly how checkmk behaves in which report/view: add a dummy device in your network devices folder, that you set to be offline before you leave work today and then set it to be online (i.e. use a valid IP again or unblock it on the firewall) when you start tomorrow and check its availability report for the last 2 days ![]()
Good idea, but I guess it won’t reference the time frame in the report itself at the top right?
You can always use “Add page element” and then add a single line of text, where you can manually list/explain the service period being followed. I guess this would hit a limit if you want to have a report over hosts/services with different service periods though ![]()
Well I was more thinking something that shows the rule is in place to confirm it rather than only a descriptive element.
I tested this successfully with the dummy device I put in yesterday, changed the IP at 5pm and switched back on with a correct a few hours later.
So yes I think this now confirms the 9 to 5pm is in place.
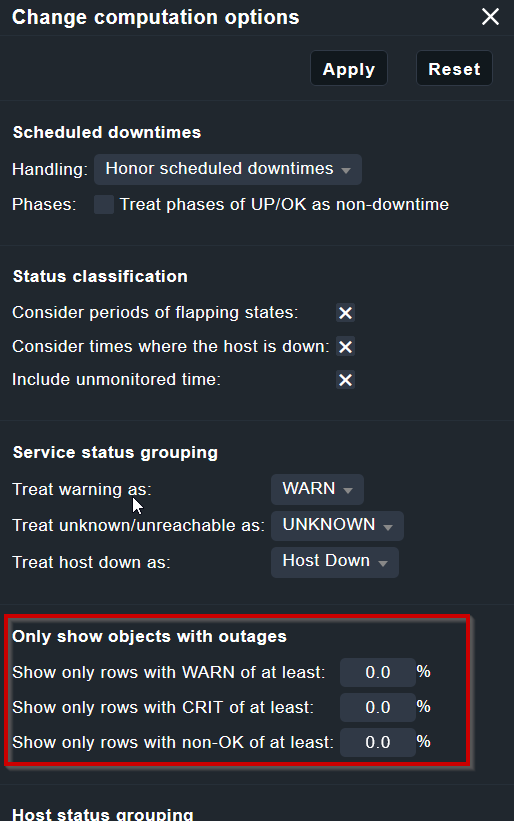
On another note, is it possible to edit a report so it shows downtime for anything above 0.5 days over a time period? I can’t think how this can be achieved.