Output of “cmk --debug -vvn gal-stun-lnx22”:
value store: synchronizing
Trying to acquire lock on /omd/sites/***/tmp/check_mk/counters/gal-stun-lnx22
Got lock on /omd/sites/***/tmp/check_mk/counters/gal-stun-lnx22
value store: loading from disk
Releasing lock on /omd/sites/***/tmp/check_mk/counters/gal-stun-lnx22
Released lock on /omd/sites/***/tmp/check_mk/counters/gal-stun-lnx22
Checkmk version 2.3.0
+ FETCHING DATA
Source: SourceInfo(hostname='gal-stun-lnx22', ipaddress='10.0.20.21', ident='agent', fetcher_type=<FetcherType.TCP: 8>, source_type=<SourceType.HOST: 1>)
[cpu_tracking] Start [7f6204b5bfe0]
Read from cache: AgentFileCache(gal-stun-lnx22, path_template=/omd/sites/***/tmp/check_mk/cache/{hostname}, max_age=MaxAge(checking=0, discovery=90.0, inventory=90.0), simulation=False, use_only_cache=False, file_cache_mode=6)
Not using cache (Too old. Age is 57 sec, allowed is 0 sec)
Connecting via TCP to 10.0.20.21:6556 (5.0s timeout)
Detected transport protocol: TransportProtocol.TLS
Reading data from agent via TLS socket
Reading data from agent
Detected transport protocol: TransportProtocol.PLAIN
Closing TCP connection to 10.0.20.21:6556
Write data to cache file /omd/sites/***/tmp/check_mk/cache/gal-stun-lnx22
Trying to acquire lock on /omd/sites/***/tmp/check_mk/cache/gal-stun-lnx22
Got lock on /omd/sites/***/tmp/check_mk/cache/gal-stun-lnx22
Releasing lock on /omd/sites/***/tmp/check_mk/cache/gal-stun-lnx22
Released lock on /omd/sites/**/tmp/check_mk/cache/gal-stun-lnx22
[cpu_tracking] Stop [7f6204b5bfe0 - Snapshot(process=posix.times_result(user=0.009999999999999787, system=0.0, children_user=0.0, children_system=0.0, elapsed=6.150000002235174))]
Source: SourceInfo(hostname='gal-stun-lnx22', ipaddress='10.0.20.21', ident='piggyback', fetcher_type=<FetcherType.PIGGYBACK: 4>, source_type=<SourceType.HOST: 1>)
[cpu_tracking] Start [7f6204b5b590]
Read from cache: NoCache(gal-stun-lnx22, path_template=/dev/null, max_age=MaxAge(checking=0.0, discovery=0.0, inventory=0.0), simulation=False, use_only_cache=False, file_cache_mode=1)
No piggyback files for 'gal-stun-lnx22'. Skip processing.
No piggyback files for '10.0.20.21'. Skip processing.
Get piggybacked data
[cpu_tracking] Stop [7f6204b5b590 - Snapshot(process=posix.times_result(user=0.0, system=0.0, children_user=0.0, children_system=0.0, elapsed=0.0))]
[cpu_tracking] Start [7f6205ba52b0]
+ PARSE FETCHER RESULTS
<<<check_mk>>> / Transition NOOPParser -> HostSectionParser
<<<cmk_agent_ctl_status:sep(0)>>> / Transition HostSectionParser -> HostSectionParser
<<<checkmk_agent_plugins_lnx:sep(0)>>> / Transition HostSectionParser -> HostSectionParser
<<<labels:sep(0)>>> / Transition HostSectionParser -> HostSectionParser
<<<df_v2>>> / Transition HostSectionParser -> HostSectionParser
<<<df_v2>>> / Transition HostSectionParser -> HostSectionParser
<<<systemd_units>>> / Transition HostSectionParser -> HostSectionParser
<<<nfsmounts_v2:sep(0)>>> / Transition HostSectionParser -> HostSectionParser
<<<cifsmounts>>> / Transition HostSectionParser -> HostSectionParser
<<<mounts>>> / Transition HostSectionParser -> HostSectionParser
<<<ps_lnx>>> / Transition HostSectionParser -> HostSectionParser
<<<mem>>> / Transition HostSectionParser -> HostSectionParser
<<<cpu>>> / Transition HostSectionParser -> HostSectionParser
<<<uptime>>> / Transition HostSectionParser -> HostSectionParser
<<<lnx_if>>> / Transition HostSectionParser -> HostSectionParser
<<<lnx_if:sep(58)>>> / Transition HostSectionParser -> HostSectionParser
<<<tcp_conn_stats>>> / Transition HostSectionParser -> HostSectionParser
<<<multipath>>> / Transition HostSectionParser -> HostSectionParser
<<<diskstat>>> / Transition HostSectionParser -> HostSectionParser
<<<kernel>>> / Transition HostSectionParser -> HostSectionParser
<<<md>>> / Transition HostSectionParser -> HostSectionParser
<<<vbox_guest>>> / Transition HostSectionParser -> HostSectionParser
<<<job>>> / Transition HostSectionParser -> HostSectionParser
<<<timesyncd>>> / Transition HostSectionParser -> HostSectionParser
<<<timesyncd_ntpmessage:sep(10)>>> / Transition HostSectionParser -> HostSectionParser
<<<local:sep(0)>>> / Transition HostSectionParser -> HostSectionParser
HostKey(hostname='gal-stun-lnx22', source_type=<SourceType.HOST: 1>) -> Add sections: ['check_mk', 'checkmk_agent_plugins_lnx', 'cifsmounts', 'cmk_agent_ctl_status', 'cpu', 'df_v2', 'diskstat', 'job', 'kernel', 'labels', 'lnx_if', 'local', 'md', 'mem', 'mounts', 'multipath', 'nfsmounts_v2', 'ps_lnx', 'systemd_units', 'tcp_conn_stats', 'timesyncd', 'timesyncd_ntpmessage', 'uptime', 'vbox_guest']
HostKey(hostname='gal-stun-lnx22', source_type=<SourceType.HOST: 1>) -> Add sections: []
Received no piggyback data
CPU load 15 min load: 0.13, 15 min load per core: 0.13 (1 cores)
CPU utilization Total CPU (15 min average): 11.52%
Check_MK Agent Version: 2.3.0, OS: linux, Agent plug-ins: 0, Local checks: 0
Disk IO SUMMARY Read: 910 B/s, Write: 18.7 kB/s, Latency: 612 microseconds
Filesystem / [/dev/sda2], Used: 56.18% - 11.8 GB of 21.0 GB (warn/crit at 79.90%/89.95% used), therein reserved for root: 5.20% (1.09 GB), trend per 1 day 0 hours: +16.7 MB, trend per 1 day 0 hours: +0.08%, Time left until disk full: 1 year 183 days, Inodes used: 9.64%, Inodes available: 1,184,361 (90.36%)
Interface ens160 [2], (up), MAC: 00:50:56:97:73:26, Speed: 10 GBit/s, In average 15min: 264 kBit/s (<0.01%), Out average 15min: 620 kBit/s (<0.01%), Total average 15min: 884 kBit/s (<0.01%)
Interface lo [1], (up), MAC: 00:00:00:00:00:00, Speed: unknown, In average 15min: 24.6 Bit/s, Out average 15min: 24.6 Bit/s, Total average 15min: 49.2 Bit/s
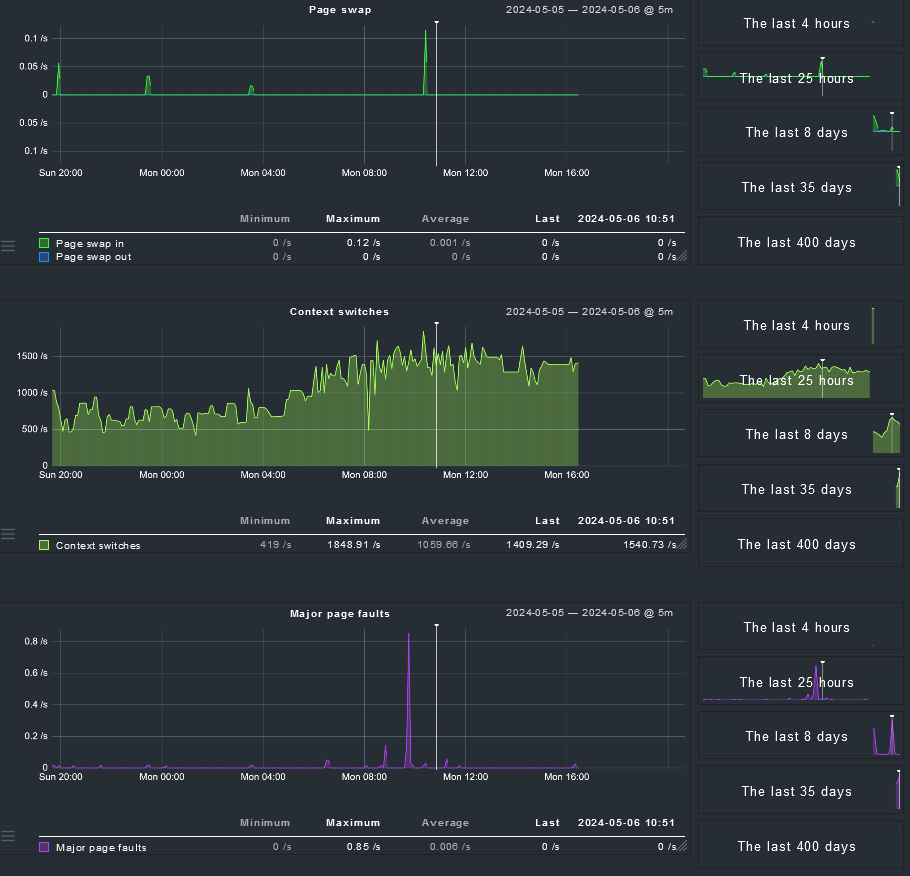
Kernel Performance Process Creations: 4.19/s, Context Switches: 1311.52/s, Major Page Faults: 0.02/s, Page Swap in: 0.00/s, Page Swap Out: 0.16/s
Memory Total virtual memory: 13.97% - 822 MiB of 5.75 GiB, 9 additional details available
Mount options of / Mount options exactly as expected
Number of threads 283, Usage: 1.91%
Systemd Service Summary Total: 151, Disabled: 3, Failed: 0
Systemd Socket Summary Total: 22, Disabled: 0, Failed: 0
Systemd Timesyncd Time Offset: 1 millisecond, Time since last sync: 30 minutes 51 seconds, Time since last NTPMessage: 30 minutes 51 seconds, Stratum: 2.00, Jitter: 2 milliseconds, Synchronized on 185.125.190.56
TCP Connections Established: 4
Uptime Up since 2024-04-23 17:13:06, Uptime: 13 days 3 hours
No piggyback files for 'gal-stun-lnx22'. Skip processing.
No piggyback files for '10.0.20.21'. Skip processing.
[cpu_tracking] Stop [7f6205ba52b0 - Snapshot(process=posix.times_result(user=0.040000000000000036, system=0.0, children_user=0.0, children_system=0.0, elapsed=0.03999999910593033))]
[agent] Success, [piggyback] Success (but no data found for this host), execution time 6.2 sec | execution_time=6.190 user_time=0.050 system_time=0.000 children_user_time=0.000 children_system_time=0.000 cmk_time_agent=6.140