Welcome,
in the RAW version, is it possible to get a graph of the availability of the monitored servers? While I have access to CPU/RAM usage graphs, I need to get an availability graph on a monthly basis.
It depends on what you define as availability for a server.
In the raw edition the host check command is check_icmp which has packet loss as a metric in a graph. Where packet loss is 100% your server is not available.
Thanks for reply ![]()
And in this version, is it possible to create a report for a specific server? The idea is to generate a report so I can present it to my superiors
Please have a look at the docs:
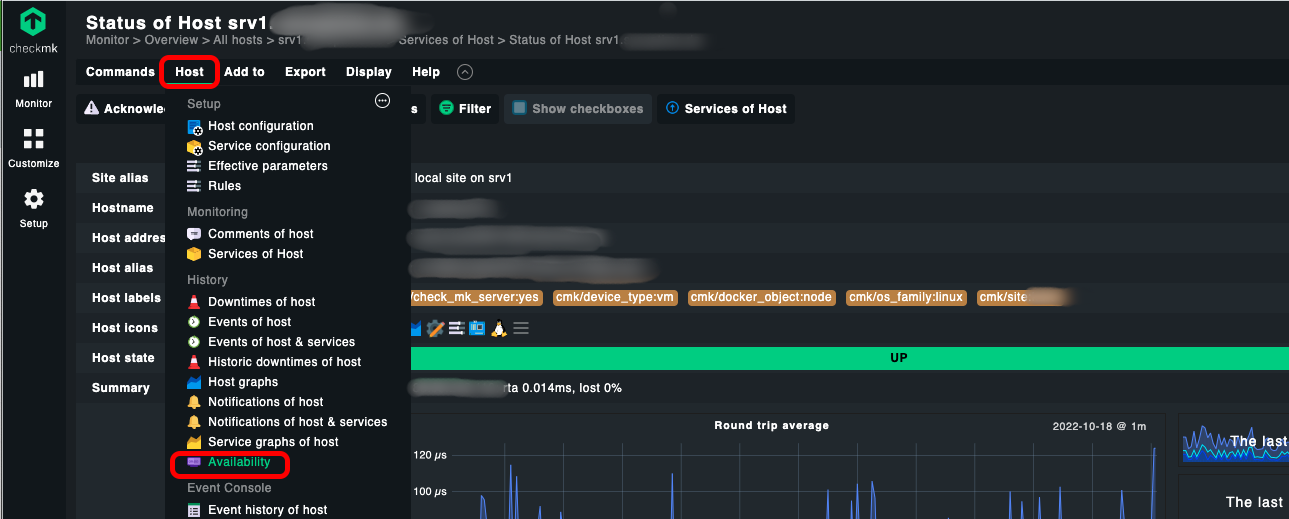
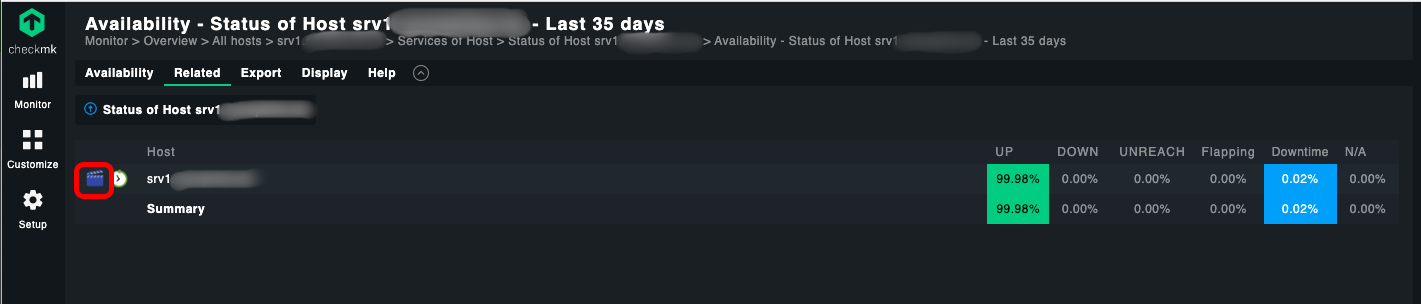
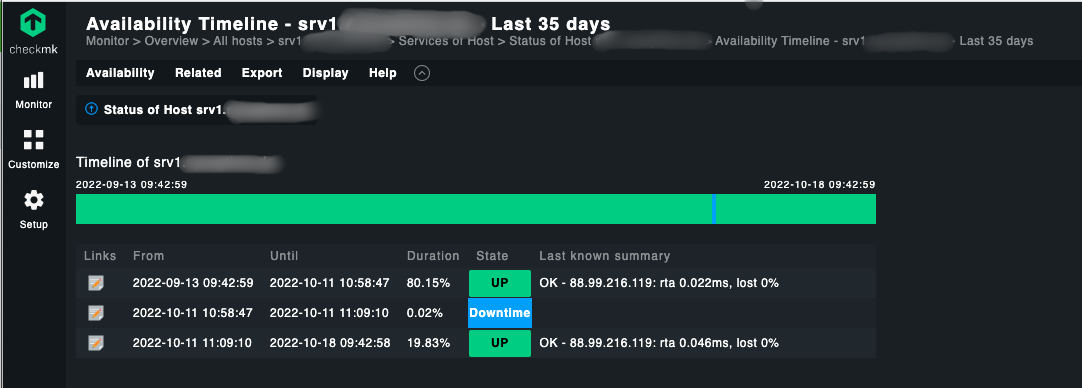
On the status page of each host, there’s an entry “Availability” in the “Host” menu. There’s also a nice “Timeline” display.
1 Like
This topic was automatically closed 365 days after the last reply. New replies are no longer allowed. Contact an admin if you think this should be re-opened.