I monitor a Dell Poweredge server with SNMP. I get the rpm for the system fans in. But by default there is no graph for this type of service.
Is there any chance to add a graph for this and how to do it?
Thanks.
BR
I monitor a Dell Poweredge server with SNMP. I get the rpm for the system fans in. But by default there is no graph for this type of service.
Is there any chance to add a graph for this and how to do it?
Thanks.
BR
Hi BR ![]()
i think the easiest and my preferred way would be to switch to the redfish plugin and use that for management board monitoring, as these metrics are fetched with it and the pulling of the data is more reliable than with snmp.
If you don´t want that and the value for the fan speed is already there, you can copy the check plugin to the corresponding local path and add your own metric output in the check function:
    yield Metric(
        name = "rpm",
        value = fan_speed, *#the variable that has the metric value*
        levels = (80.0, 90.0),
        boundaries = (0.0, 100.0), *# Depending on the speed of the fans*
    )
Hi Andre,
ok, this sounds nice. The last time I’ve used Checkmk in very basic way, installation + agent and it was fine for me. Now I’ll try to dive deeper but it is not easy. I’m using the raw version. Are there these extensions / plugins available? I’ve found some howto’s but all describe the way with Setup-Menue and Extension packages. This menue I do not have (or I do not find). Maybe not available on raw edition?
How to get and setup the Redfish Plugin? Is there some step be step howto for beginners?
Thanks.
BR
Hi,
the redfish plugin is part of checkmk since 2.3 but it is not enabled by default.
You need to enable the extension package with the command
mkp enable redfish
as the site User.
After that you will finde the rule “redfish compatible management controller” in checkmks setup.
You will need a local user on the management board with read only permissions.
OK, this worked so far.
Now I habe the rule available. And now? + Add rule and what to enter there? Where I can find documentation about this plugin and how to setup?
you just enter the username and password for the management board(s) and assign these via the condition (folder, hostnames, regex…) to your boards.
The boards need to be separate hosts in checkmk.
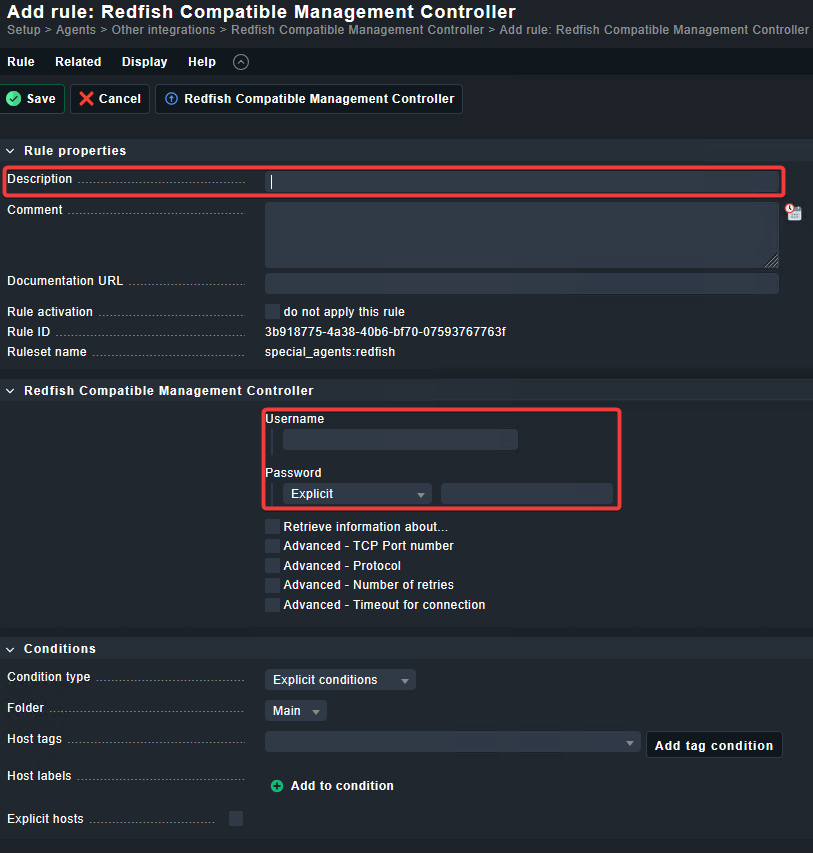
Hmm, I don’t get it. If I add a rule I get this:
I can enter the red marked variables, but where to enter the IP adress of the target system (the PowerEdge server)?
You assign it in the conditions to your hosts, the simplest condition would be explicit hosts, where you enter the Hostname of the mgmt Board.
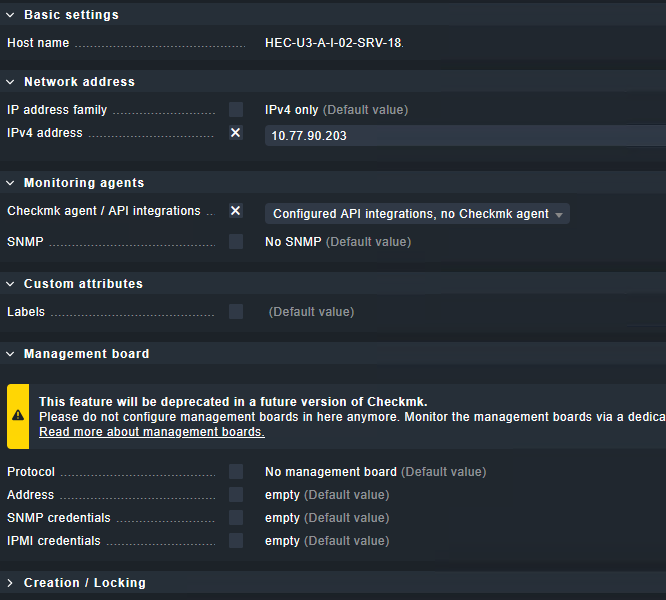
You have to create the Host first and make sure, that you disable snmp and enable “api Access, no checkmk Agent”
I’ve setup now for the host:
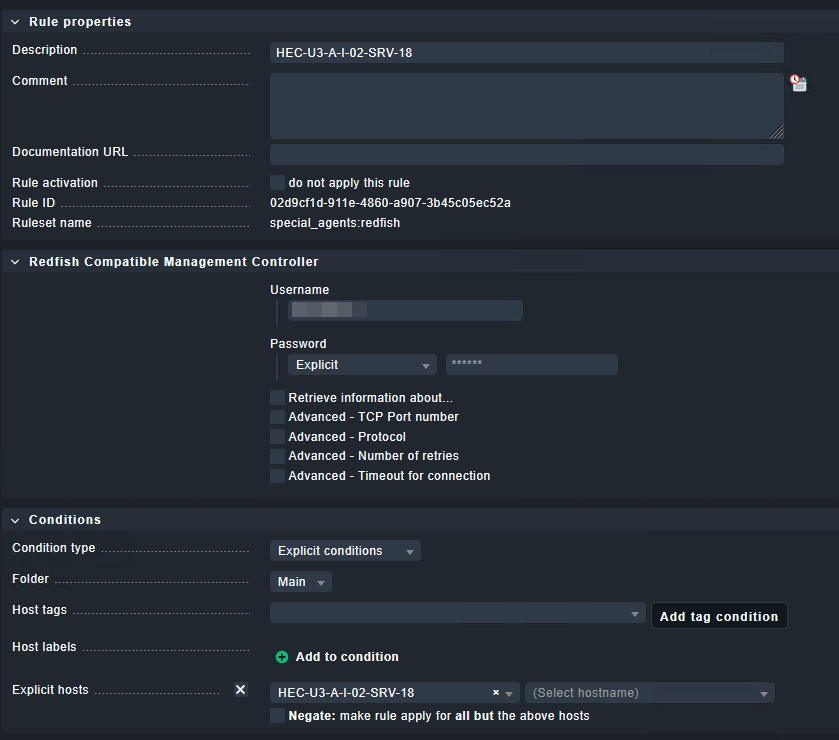
And for Redfish:
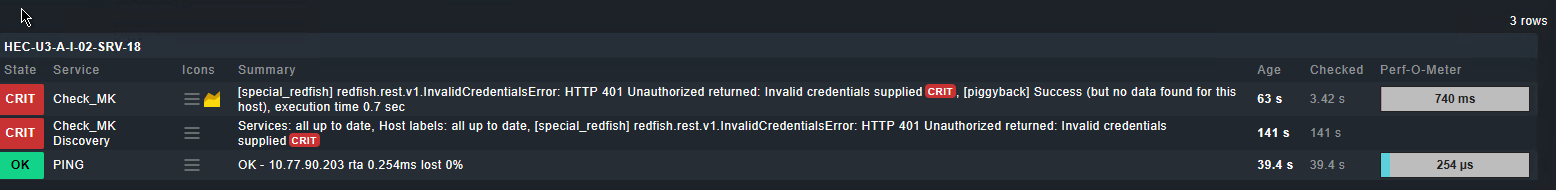
But I get only this in the host view:
What’s missing ?
Did you create the user in the Management Board? Is the Hostname the name of the Board or the Server itself?
Maybe I did not interprete it correct:
Management board is that idrac on Poweredge? There I have da RO user which I entered in “Redfish Compatible Management Controller - Username”. The password of this user in the “Password” field.
The checkmk Host (label) is named with HEC-U3-… , it is the physical location of the Poweredge. The hostname is not used, it is configured with the idrac ip adress 10.77.90.203 in the host setup.
Yes for all questions.
In excplicit host name you enter the hostname of the idrac. If that is an IP address, use this.
i would recommend to add the idrac with its hostname and set the IP address manually in the host properties, if its not resolvable.
Beside all the hints from @aeckstein i would also say, please check the provided credentials directly on the iDRAC. I had many systems that required a password change on first login (especially Lenovo systems) if this was explicitly disabled at user account creation time.
This manual login must work with the user.
If this is ok please check the user and password inside CMK again.
One other point is to update the Redfish mkp to the latest version.
This can be found in the Exchange or on the linked github page.
Hi,
it is working now. The cause was that there was not checked “idrac access” to the created user. I had just cloned a snmp user but this will not work with Redfish.
Thanks,
BR
Hi again,
one open topic:
Redfish and SNMP monitoring to the Dell iDRAC is similar but not the same. I get a bit more details out auf the SNMP except the fans.
So I have switched on Redfish and SNMP for this host now. But I get duplicate values and therefor errors in the “Site activation panel”.
E.g.
check_mk: ERROR: Duplicate service description (auto check) ‘Temperature GPU Temp 2’ for host ‘SRV-18’! - 1st occurrence: check plug-in / item: dell_poweredge_temp / ‘GPU Temp 2’ - 2nd occurrence: check plug-in / item: redfish_temperatures / ‘GPU Temp 2’
How can I only disable the duplicate checks?
Disabling the service in the discorvery panel is not possible wo a single service, then both will disable (I think of the same name). ![]()
BR
What do you get as extra information?`
I would not recommend to have SNMP and API active on the management interfaces.
E.g. state of disk drives and raid, ethernet adapters and physical details of them. And some more.
This must be available inside Redfish output.
This topic was automatically closed 365 days after the last reply. New replies are no longer allowed. Contact an admin if you think this should be re-opened.