CMK version:
OMD - Open Monitoring Distribution Version 2.1.0p20.cee
OS version:
“Debian GNU/Linux 11 (bullseye)”
Error message:
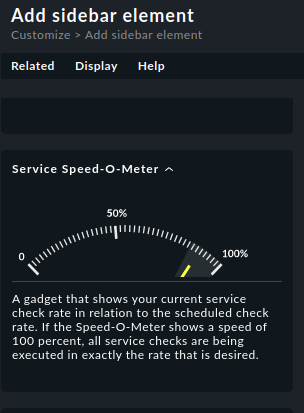
Low percentage on Service Speed-o-Meter. It frequently dips down to 60%
Hellos!
Could you please explain, what the speed-o-meter is measuring and how to get it to 100%?
It is part of the default dashboard (i think?) so it seems important.
All server-stats I see seem to indicate that there are loads of resources left.
Please ask me for detailed information.
A gadget that shows your current service check rate in relation to the scheduled check rate. If the Speed-O-Meter shows a speed of 100 percent, all service checks are being executed in exactly the rate that is desired.
I’m simplifying a bit, but here is the general idea of this gauge:
If you have (for example) 9.000 Services in total and checkmk checks them every minute, then the scheduled check rate is 9.000 / 60 secs = 150 services/sec.
If it is currently only doing 75 services per second, then the display shows 50%. This is no reason to panic, because it can happen that checkmk does most of the 9,000 services in the first 20 seconds of a minute (because it is so fast) and then in the remaining 40 seconds the rate drops automatically because all the work is already done.
You only have to worry if the value is never close to 100 %.
Okay. It goes to 100% a lot. Then I guess I’ll just get rid of the widget. Strange thing this. Also, I have not found any documentation about that. If someone who can write manuals is reading this: please make the speed-o-meter clickable and have it point to a view of the relevant statistics and lots of explanations on how to read these and what to do if any of them are bad.
You are welcome. If you tickle the widget with the mouse it will show the current and scheduled rate and their relation (e.g. current=75 checks/s, scheduled=150 → 50%). If the widget is not yet part of the sidebar but still in the list of all widgets some help text is shown:
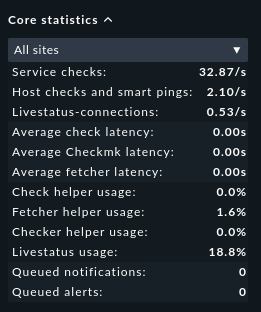
Much more important is the core statistics widget, especially the helper usages. If they are permanently close to 100% this means that checkmk uses everything it can at full power to get the work done, i.e. it runs at its (or the machine’s) limits. In my case I’m far away from that:
This topic was automatically closed 365 days after the last reply. New replies are no longer allowed. Contact an admin if you think this should be re-opened.