Hi everyone,
I would like to set up a simple https site monitoring. I woluld like test the validity of the ssl certificate, the response time and the fixed string in the response. All info is collecting correctly. However, I would like to have historical data on a graph to show when the status of the page was different from the fixed string. When I copied internal graphs from service into dashboard, I always have packet size + response time. I can add new gpaph with response time only.
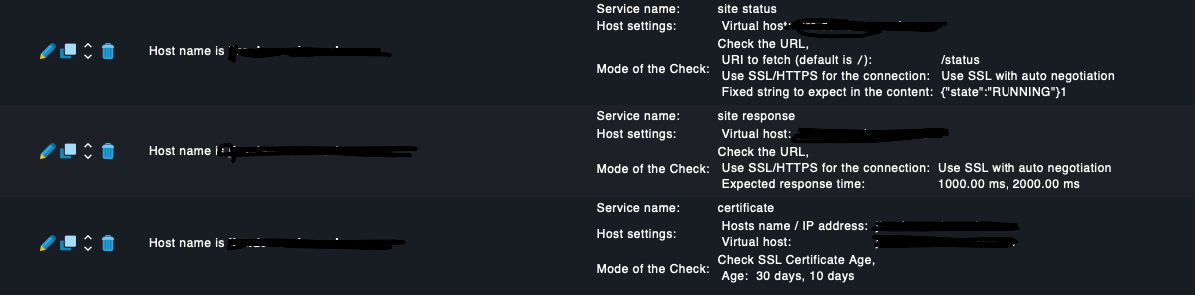
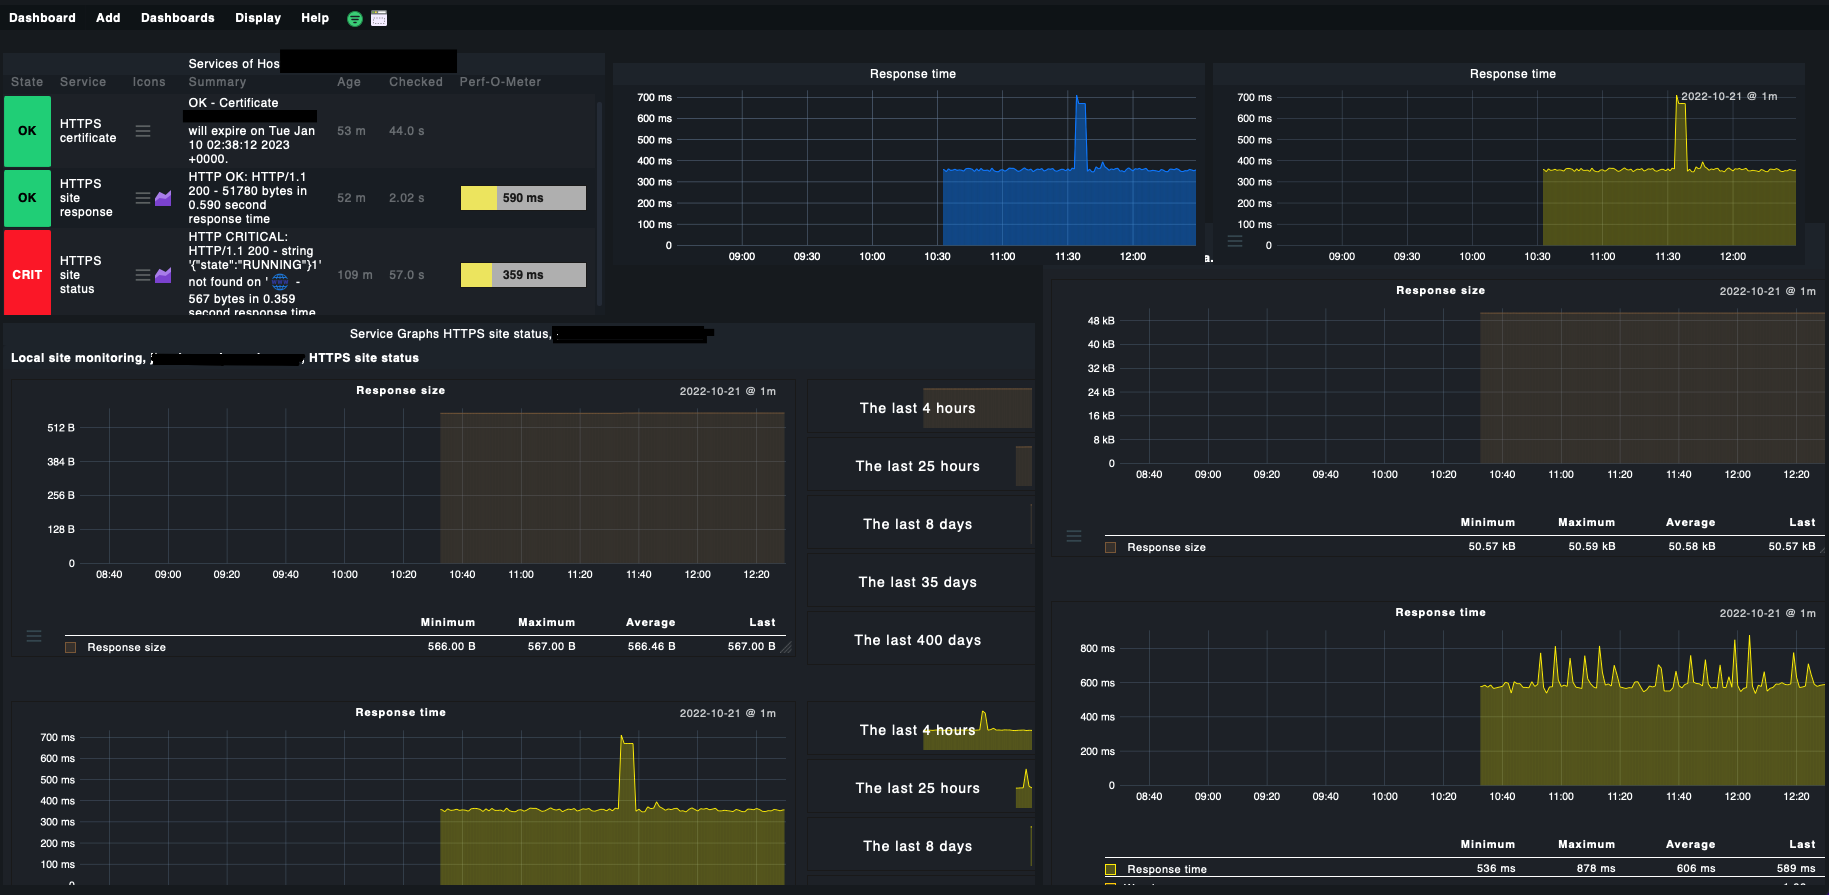
Below is an example of the service configuration and the dashboard created.
When the service status changes to critical then the chart still has data because the page is still responding. I would like to have historic data graph with status changes.
How can I solve this?
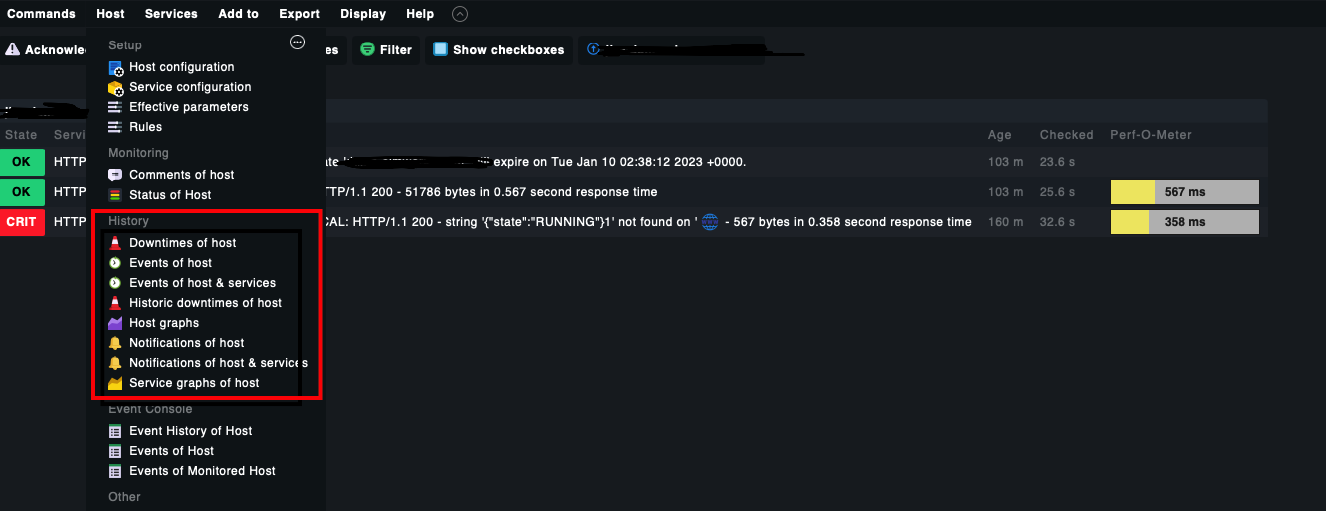
Your screen shot probably shows the “Services of Host …” page?
Click on one of the services, then you should find Availability for that service in the Service menu.
Or go to the “Status of Host …” page (click on the host name) and find Availabilty in the Host menu there.
This topic was automatically closed 365 days after the last reply. New replies are no longer allowed. Contact an admin if you think this should be re-opened.