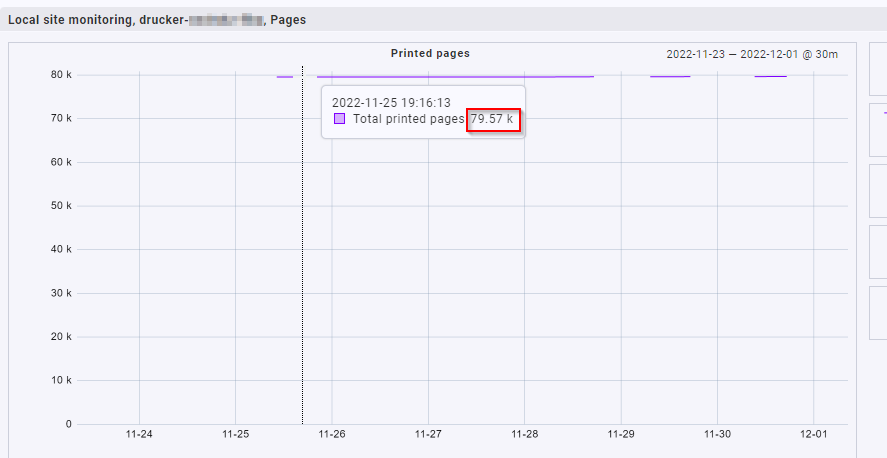
I have to monitor the pages of our printers and I like to know how many pages are printed within a timerange (e.g week, month). The chart on tooltip is showing a rounded number e.g. 79.57 k
But I need the exact number for an offer for new printers.
Easiest way to achieve this is the following.
After selecting the graph go to “Display” → “Modify display options” → “Graph time range”
Here you select a define range or insert your own dates.
Now you have the “Minimum” and “Maximum” value of your graph and the difference is the amount of printed pages.
The number is not really a rounded value. It makes no difference if it is 79571 or 79579 pages as shown in your example.
This topic was automatically closed 365 days after the last reply. New replies are no longer allowed. Contact an admin if you think this should be re-opened.