Hello everyone,
we are using CheckMK version 2.0.0p39 (CRE) and I want to adjust a service graph for one of our services.
The values that our service receives from the agent are queue sizes, which means they are all Integer values. My problem is though, that the summary below the graph and hovering over the area in the graph seemingly shows interpolated float values.
This is my metrics configuration:
metric_info["QueueSize_normal"] = {
  "title": _("queue size of normal jobs"),
  "unit": "count",
  "color": "#3e54cf",
}
metric_info["QueueSize_priority"] = {
  "title": _("queue size of priority jobs"),
  "unit": "count",
  "color": "#c83ecf",
}
graph_info["QueueSize_normal"] = {
  "title": _("queue sizes"), # of logbook entry generation
  # combine both metrics in one graph
  "metrics": [
    ("QueueSize_normal", "area"),
    ("QueueSize_priority", "area")
  ],
  # show lines for warn and crit in graph
  "scalars": [
    "QueueSize_normal:warn",
    "QueueSize_normal:crit",
  ],
  # range for y-axis
  "range": (0, "QueueSize_normal:crit"),
}
This is how the graph looks:
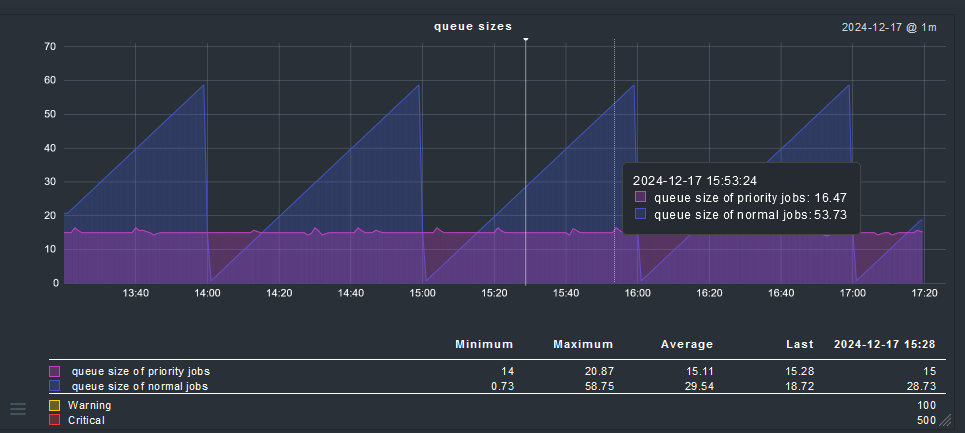
My question:
How can I achieve the graph showing Integer values instead of interpolated float values for the shown data like min, max, avg, last and the hovered over values?
I had a look into the example files of cmk/gui/plugins/metrics/ but i didn’t find a helpful clue. Seems like the ‘unit’ isn’t used for converting the data, it only determines what sign is shown after the number, like unit = “%” leads to showing a “%” sign after the displayed number.