CEE 2.1, You can take the Windows and/or Linux sample dashboards and copy and turn them into templates for various “types” of server dashboards you want. For example, for our domain controllers, I include a DNS request/s graph (requires that you create a plugin for that).
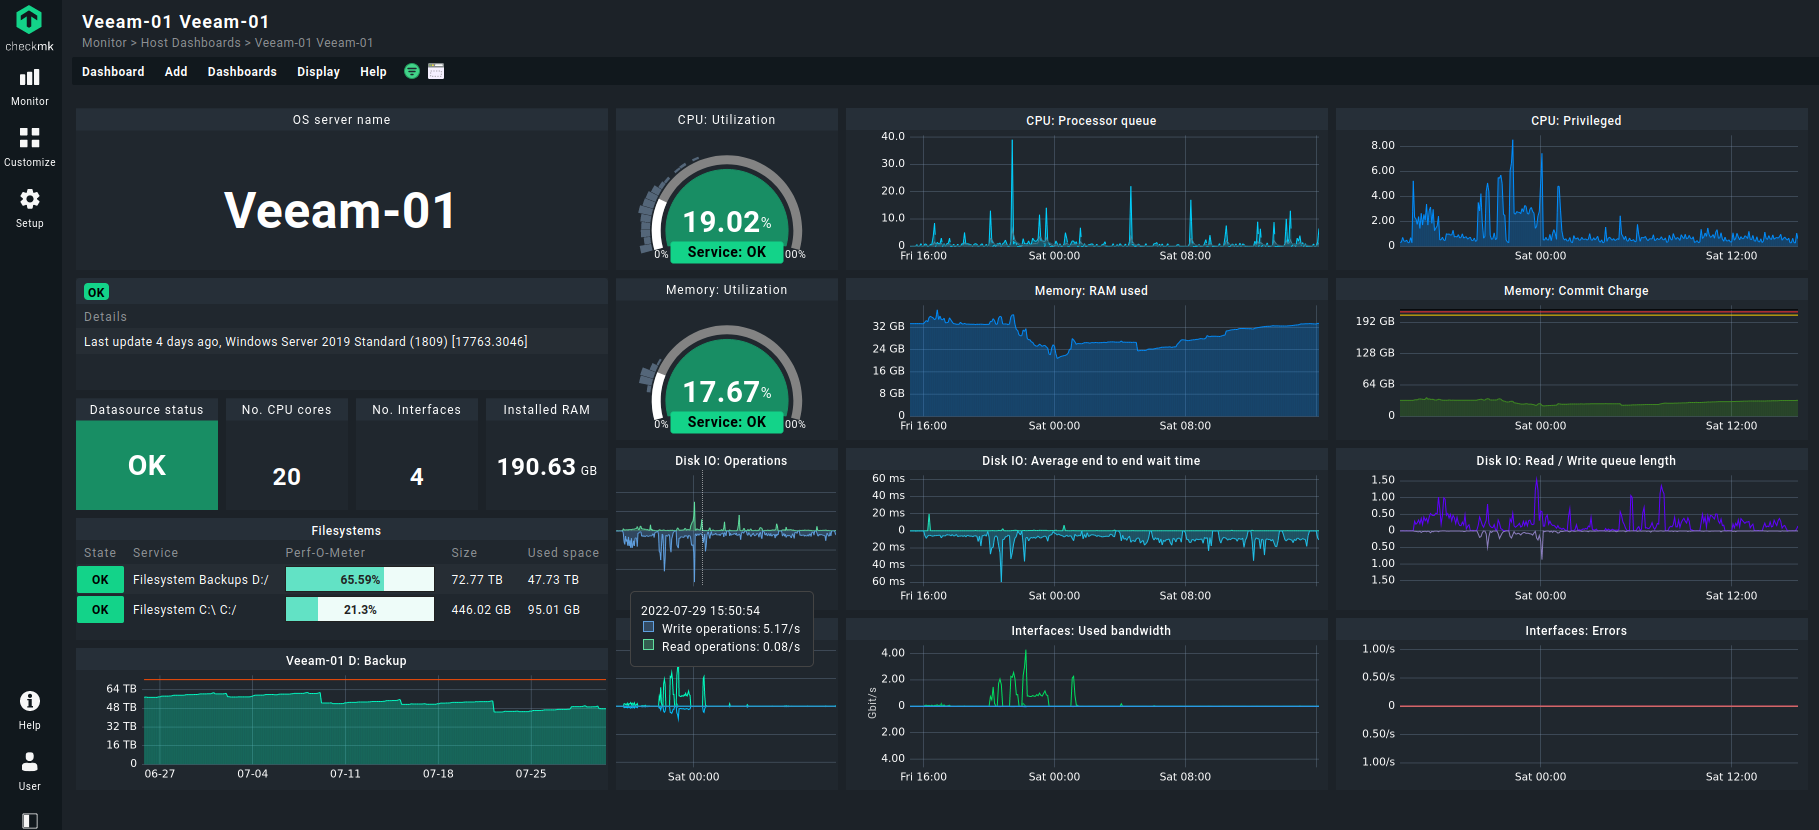
I altered the generic Windows dashboard to make a template that includes our last updated check, which also show the full version of Windows installed (since the inventory doesn’t do that). About the only thing I wish we had was the ability to pull in Inventory model and serial (missing that ability) into a smaller dashlet. While we could get the model, it’s just too large. Need to be able to make dashboard items smaller and of course maybe aggregate multiple into one dashlet object.
Also missing currently from dashboard is a way to add a forecast graph. As one of my motivators was that our Veeam host was starting to rapidly fill up, and having the forecast would have been nice.
Cool!
Do you have the information you need in the inventory? Because then, there is a trick how to get them into this dashboard. Happy to share if needed
Nice !
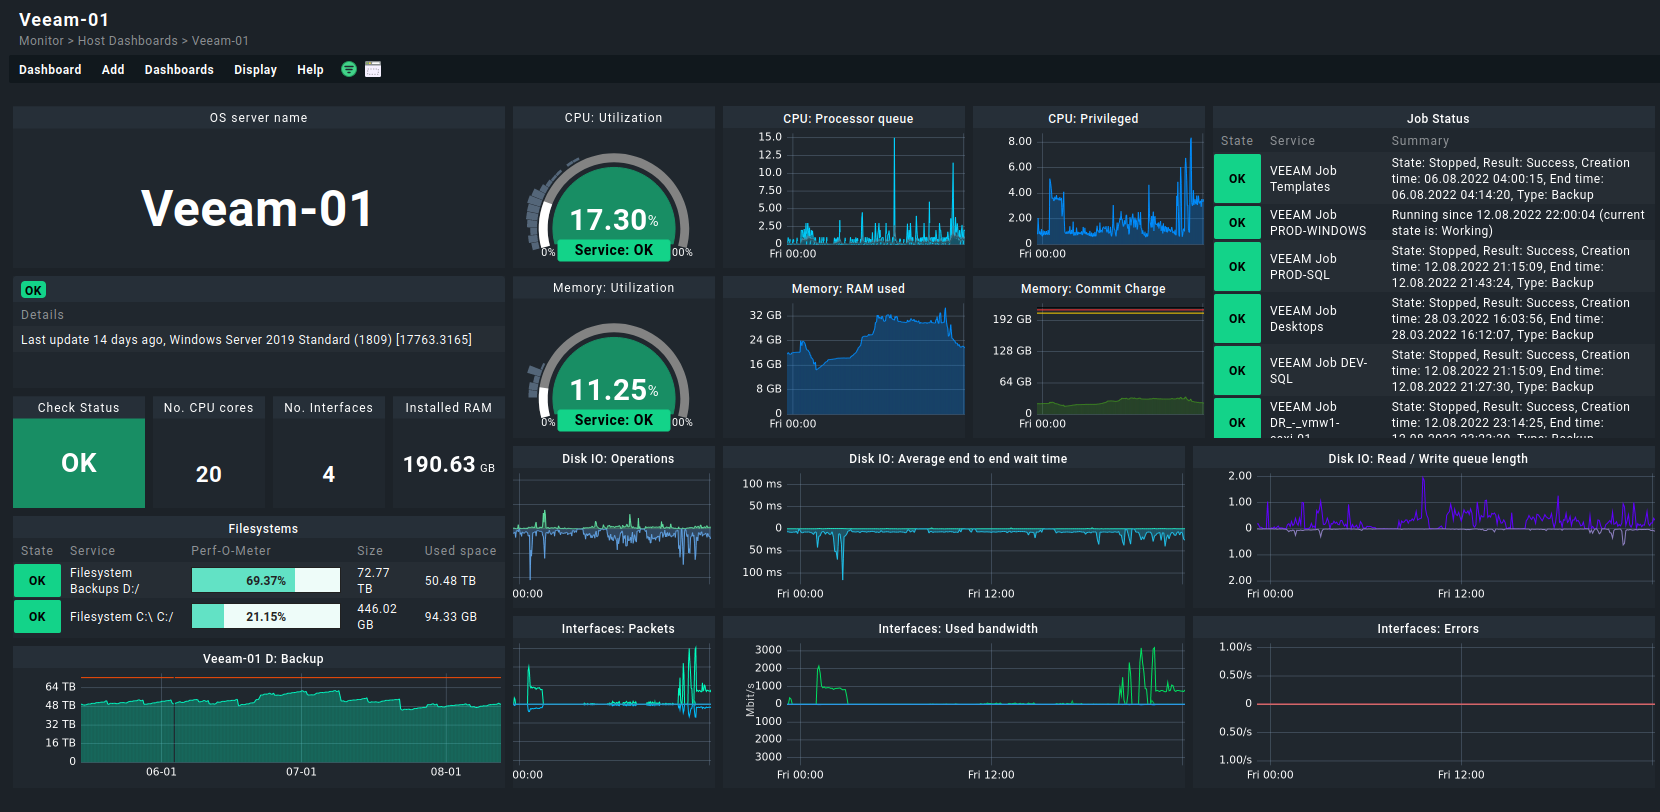
I would also add the Veeam Windows Service states and the info about veeam backup, cdp and tape jobs as seperate tables, to make it look more like a veeam dashboard
Yes… I’ll look into it. I know that combined “graph wise” you get into the whole “100 limit” issue. Not sure if I can somehow pull individual metrics and sum up, etc. for a value or gauge or something like that.
There’s good information in the Host Inventory under System. Like Serial number, Express Service Code, at least on Dell physical equipment. Would be nice to know if any of that can be exposed dashboard wise.
The inventory dashlet can be extended to also show any inventory information.
For that copy /lib/python3/cmk/gui/cee/plugins/dashboard/inventory.py into your local hierarchy.
And then edit the following code segment by adding the inventory fields, which you want the dashlet to be able to display:
AVAILABLE_INVENTORY: Mapping[str, RenderHint] = {
    # This is a hack: Normally we would reuse the rendering logic of the
    # inventory, and allow all inventory values, but this uses html tags too
    # early in the process so we can not reuse this code. We accept a bit of
    # duplicated logic here. If this list grows above 10 elements we should
    # think about tidying up everything!
    ".hardware.cpu.arch": RenderHint(),
    ".hardware.cpu.max_speed": RenderHintFrequency(),
    ".hardware.cpu.cores": RenderHint(),
    ".hardware.memory.total_ram_usable": RenderHintBytes(),
    ".hardware.memory.total_swap": RenderHintBytes(),
    ".hardware.system.model": RenderHint(),
    ".hardware.system.manufacturer": RenderHint(),
    ".networking.total_interfaces": RenderHint(),
    ".networking.total_ethernet_ports": RenderHint(),
    ".networking.hostname": RenderHint(),
    ".software.applications.check_mk.agent_version": RenderHint(),
    ".software.os.type": RenderHint(),
    ".software.os.vendor": RenderHint(),
    ".software.os.version": RenderHint(),
    ".software.applications.kube.cluster.version": RenderHint(),
    ".software.applications.kube.metadata.name": RenderHint(),
    ".software.applications.kube.metadata.namespace": RenderHint(),
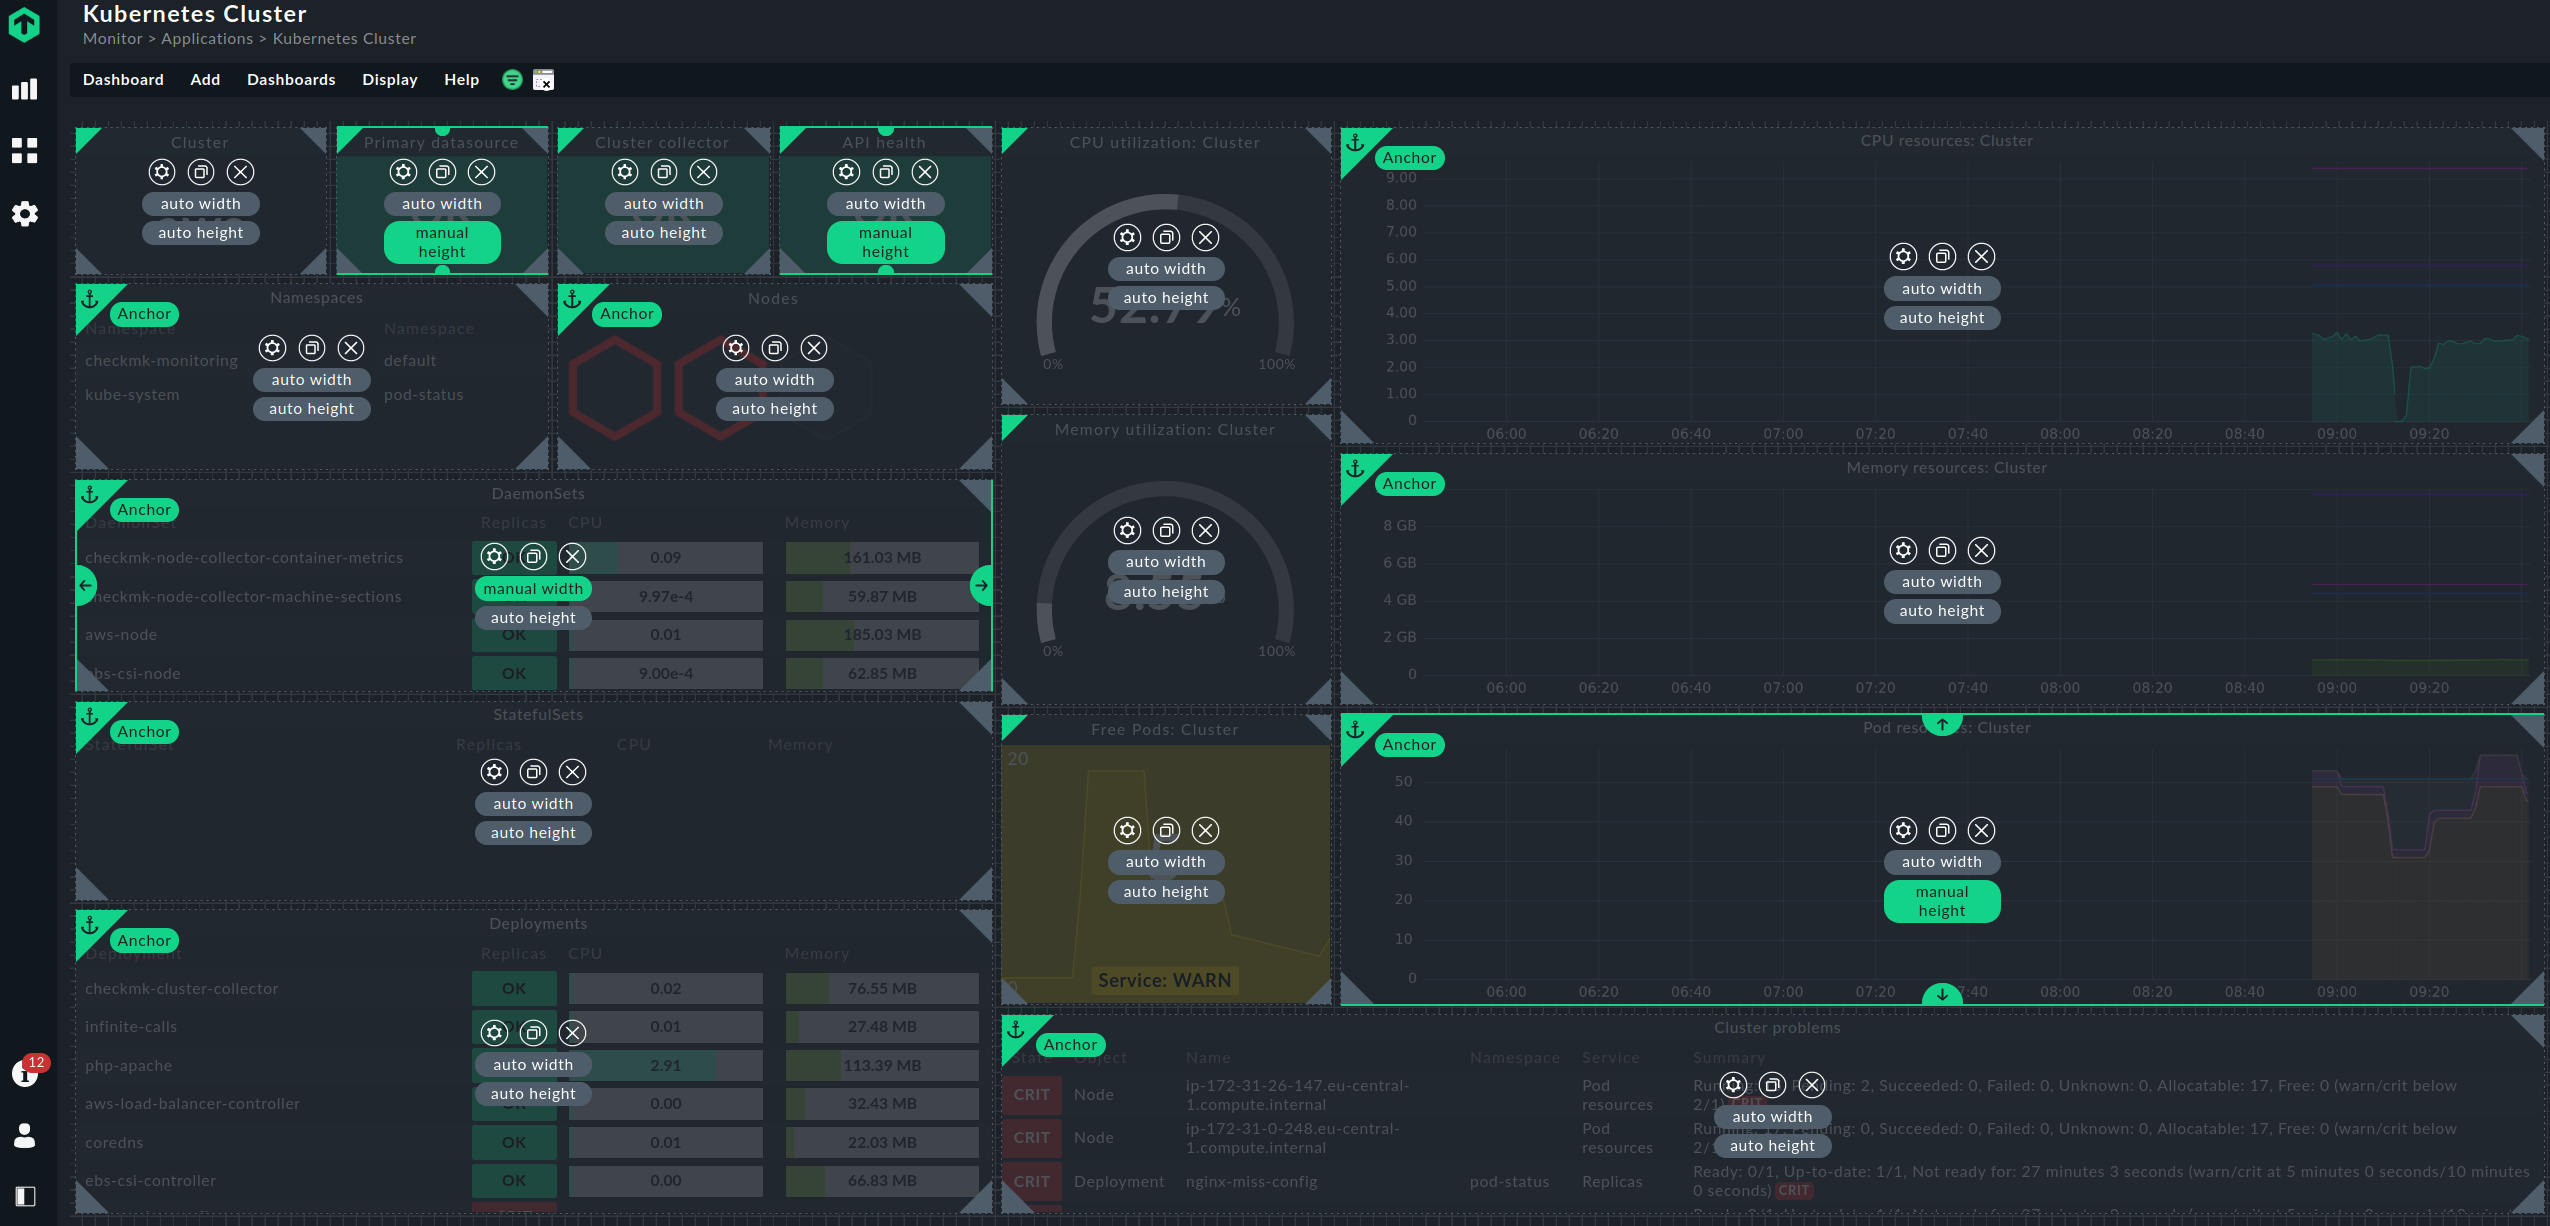
One of the best practices for dashboards is to put Services lists at the bottom of the dashboard with “auto-height” set. They grow best with larger screen sizes / zoom out. See below
True. But it does greatly greatly limit design. Checkmk dashboard’s layout mechanisms and controls need a lot of work. I’m mean, it’s “ok” for what it is. But no matter what you do, they are messy at best.
My Veeam dashboard in this case is a fixed height dashboard, which is ok.
For example, I am actually a big fan, that they are restricted in height in contrast to many other dashboard tools. This way you are forced to only show the stuff which really matters. For example this dashboard from Wikipedia: would you use it in operations, e.g. on a big TV screen? They were not restricted / forced to prioritize what to show.
On the other hand side, positioning of new dashlets always at the top annoys me a lot. Switches from one dashlet to the other for visualizing stuff without having to reconfigure the data source, would also be helpful for me.
First, they are not restricted in height. I was just saying that my specific dashboard is. Depending on your design you can have (though limited) dynamic growth both horizontally and vertically. My fixed height example can dynamically grow horizontally. IMHO, Checkmk dashboards aren’t for “big vertical scroll” style display (YMMV).
It’s not perfect. Dashlets don’t fully scale and are restricted to a fixed minimum size, etc. Some operations in layout are “dependent” on order, which can make it frustrating sometimes.
The Grafana web output you gave as an example, is actually pretty primitive, but it is an approach and fairly common to do the “big vertical with scroll”. But as you said, maybe this isn’t for a big monitor “control center” style display. I would think Checkmk dashboards are better suited for that.
Also, I do pull in data from Checkmk and netdata into my “portal”, where I can give some of that “combined” portlet effect, just nothing that Checkmk “graphs” can’t be embedded. But fine for view displays and even dashboards, if they have zero graphs.
Note: you can pull in white themed like PNG graph images from Checkmk, just not the dynamic interactive graphs.
This topic was automatically closed 365 days after the last reply. New replies are no longer allowed. Contact an admin if you think this should be re-opened.