CMK version: 2.1.0p16 CRE
OS version: Debian 11.5 (bullseye)
Error message:
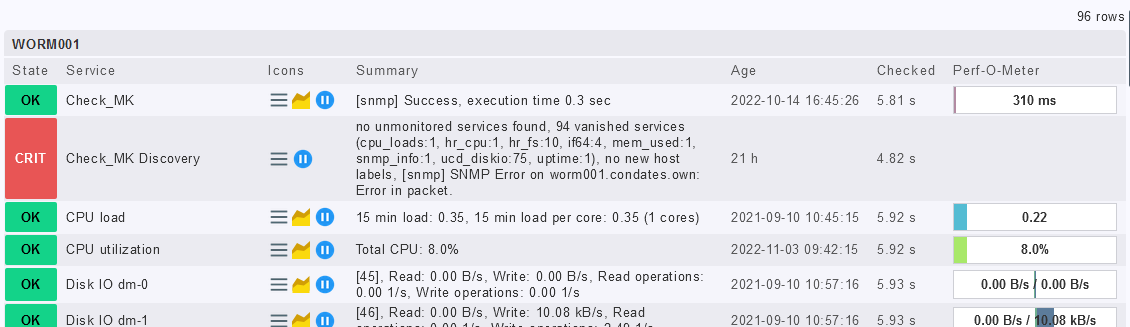
Check_MK Discovery of a FAST LTA Silent Brick shows all previous discovered services as vanished after upgrade from 2.0.0p28 to 2.1.0p16 CRE. The services still show as OK and have sensible data.
Screenshot:
Output of cmk -vv --snmpwalk WORM001:
WORM001:
Walk on ".1.3.6.1.2.1"...
Running 'snmpbulkwalk -Cr10 -v2c -c public -m "" -M "" -t 3.50 -r 4 -Cc -OQ -OU -On -Ot worm001.dom.local .1.3.6.1.2.1'
4682 variables.
Walk on ".1.3.6.1.4.1"...
Running 'snmpbulkwalk -Cr10 -v2c -c public -m "" -M "" -t 3.50 -r 4 -Cc -OQ -OU -On -Ot worm001.dom.local .1.3.6.1.4.1'
ERROR: SNMP error: Error in packet.
Reason: noAccess
Error: SNMP Error on worm001.dom.local: Error in packet.
Reason: noAccess (Exit-Code: 2)
Wrote fetched data to /omd/sites/cmk01/var/check_mk/snmpwalks/WORM001.
Output of “cmk --debug -vvn hostname”:
Spoiler
Checkmk version 2.1.0p16
Try license usage history update.
Trying to acquire lock on /omd/sites/cmk01/var/check_mk/license_usage/next_run
Got lock on /omd/sites/cmk01/var/check_mk/license_usage/next_run
Trying to acquire lock on /omd/sites/cmk01/var/check_mk/license_usage/history.json
Got lock on /omd/sites/cmk01/var/check_mk/license_usage/history.json
Next run time has not been reached yet. Abort.
Releasing lock on /omd/sites/cmk01/var/check_mk/license_usage/history.json
Released lock on /omd/sites/cmk01/var/check_mk/license_usage/history.json
Releasing lock on /omd/sites/cmk01/var/check_mk/license_usage/next_run
Released lock on /omd/sites/cmk01/var/check_mk/license_usage/next_run
- FETCHING DATA
Source: SourceType.HOST/FetcherType.SNMP
[cpu_tracking] Start [7fcf07b79c70]
[SNMPFetcher] Fetch with cache settings: SNMPFileCache(WORM001, base_path=/omd/sites/cmk01/tmp/check_mk/data_source_cache/snmp, max_age=MaxAge(checking=0, discovery=120, inventory=120), disabled=False, use_outdated=False, simulation=False)
Not using cache (Too old. Age is 24 sec, allowed is 0 sec)
[SNMPFetcher] Execute data source
SNMP scan:
Getting OID .1.3.6.1.2.1.1.1.0: Running ‘snmpget -v2c -c public -m “” -M “” -t 3.50 -r 4 -On -OQ -Oe -Ot worm001.dom.local .1.3.6.1.2.1.1.1.0’
SNMP answer: ==> [“Linux worm001 5.4.109-gentoo-FAST #1 SMP Mon Aug 23 09:35:51 CEST 2021 x86_64”]
b’Linux worm001 5.4.109-gentoo-FAST #1 SMP Mon Aug 23 09:35:51 CEST 2021 x86_64’
Getting OID .1.3.6.1.2.1.1.2.0: Running ‘snmpget -v2c -c public -m “” -M “” -t 3.50 -r 4 -On -OQ -Oe -Ot worm001.dom.local .1.3.6.1.2.1.1.2.0’
SNMP answer: ==> [.1.3.6.1.4.1.8072.3.2.10]
b’.1.3.6.1.4.1.8072.3.2.10’
Using cached OID .1.3.6.1.2.1.1.1.0: ‘Linux worm001 5.4.109-gentoo-FAST #1 SMP Mon Aug 23 09:35:51 CEST 2021 x86_64’
Using cached OID .1.3.6.1.2.1.1.2.0: ‘.1.3.6.1.4.1.8072.3.2.10’
Using cached OID .1.3.6.1.2.1.1.2.0: ‘.1.3.6.1.4.1.8072.3.2.10’
Using cached OID .1.3.6.1.2.1.1.1.0: ‘Linux worm001 5.4.109-gentoo-FAST #1 SMP Mon Aug 23 09:35:51 CEST 2021 x86_64’
Using cached OID .1.3.6.1.2.1.1.1.0: ‘Linux worm001 5.4.109-gentoo-FAST #1 SMP Mon Aug 23 09:35:51 CEST 2021 x86_64’
Using cached OID .1.3.6.1.2.1.1.1.0: ‘Linux worm001 5.4.109-gentoo-FAST #1 SMP Mon Aug 23 09:35:51 CEST 2021 x86_64’
Using cached OID .1.3.6.1.2.1.1.1.0: ‘Linux worm001 5.4.109-gentoo-FAST #1 SMP Mon Aug 23 09:35:51 CEST 2021 x86_64’
Using cached OID .1.3.6.1.2.1.1.1.0: ‘Linux worm001 5.4.109-gentoo-FAST #1 SMP Mon Aug 23 09:35:51 CEST 2021 x86_64’
SNMP scan found hr_mem snmp_uptime ucd_cpu_load
Trying to acquire lock on /omd/sites/cmk01/tmp/check_mk/snmp_scan_cache/WORM001.worm001.dom.local
Got lock on /omd/sites/cmk01/tmp/check_mk/snmp_scan_cache/WORM001.worm001.dom.local
Releasing lock on /omd/sites/cmk01/tmp/check_mk/snmp_scan_cache/WORM001.worm001.dom.local
Released lock on /omd/sites/cmk01/tmp/check_mk/snmp_scan_cache/WORM001.worm001.dom.local
hr_cpu: Fetching data (SNMP walk cache is enabled: Use any locally cached information)
Running ‘snmpbulkwalk -Cr10 -v2c -c public -m “” -M “” -t 3.50 -r 4 -Cc -OQ -OU -On -Ot worm001.dom.local .1.3.6.1.2.1.25.3.3.1.2’
ucd_cpu_load: Fetching data (SNMP walk cache is enabled: Use any locally cached information)
Running ‘snmpbulkwalk -Cr10 -v2c -c public -m “” -M “” -t 3.50 -r 4 -Cc -OQ -OU -On -Ot worm001.dom.local .1.3.6.1.4.1.2021.10.1.5’
Running ‘snmpbulkwalk -Cr10 -v2c -c public -m “” -M “” -t 3.50 -r 4 -Cc -OQ -OU -On -Ot worm001.dom.local .1.3.6.1.4.1.2021.10.1.6’
hr_fs: Fetching data (SNMP walk cache is enabled: Use any locally cached information)
Running ‘snmpbulkwalk -Cr10 -v2c -c public -m “” -M “” -t 3.50 -r 4 -Cc -OQ -OU -On -Ot worm001.dom.local .1.3.6.1.2.1.25.2.3.1.2’
Running ‘snmpbulkwalk -Cr10 -v2c -c public -m “” -M “” -t 3.50 -r 4 -Cc -OQ -OU -On -Ot worm001.dom.local .1.3.6.1.2.1.25.2.3.1.3’
Running ‘snmpbulkwalk -Cr10 -v2c -c public -m “” -M “” -t 3.50 -r 4 -Cc -OQ -OU -On -Ot worm001.dom.local .1.3.6.1.2.1.25.2.3.1.4’
Running ‘snmpbulkwalk -Cr10 -v2c -c public -m “” -M “” -t 3.50 -r 4 -Cc -OQ -OU -On -Ot worm001.dom.local .1.3.6.1.2.1.25.2.3.1.5’
Running ‘snmpbulkwalk -Cr10 -v2c -c public -m “” -M “” -t 3.50 -r 4 -Cc -OQ -OU -On -Ot worm001.dom.local .1.3.6.1.2.1.25.2.3.1.6’
hr_mem: Fetching data (SNMP walk cache is enabled: Use any locally cached information)
Already fetched OID: .1.3.6.1.2.1.25.2.3.1.2
Already fetched OID: .1.3.6.1.2.1.25.2.3.1.3
Already fetched OID: .1.3.6.1.2.1.25.2.3.1.4
Already fetched OID: .1.3.6.1.2.1.25.2.3.1.5
Already fetched OID: .1.3.6.1.2.1.25.2.3.1.6
if64: Fetching data (SNMP walk cache is enabled: Use any locally cached information)
Running ‘snmpbulkwalk -Cr10 -v2c -c public -m “” -M “” -t 3.50 -r 4 -Cc -OQ -OU -On -Ot worm001.dom.local .1.3.6.1.2.1.2.2.1.1’
Running ‘snmpbulkwalk -Cr10 -v2c -c public -m “” -M “” -t 3.50 -r 4 -Cc -OQ -OU -On -Ot worm001.dom.local .1.3.6.1.2.1.2.2.1.2’
Running ‘snmpbulkwalk -Cr10 -v2c -c public -m “” -M “” -t 3.50 -r 4 -Cc -OQ -OU -On -Ot worm001.dom.local .1.3.6.1.2.1.2.2.1.3’
Running ‘snmpbulkwalk -Cr10 -v2c -c public -m “” -M “” -t 3.50 -r 4 -Cc -OQ -OU -On -Ot worm001.dom.local .1.3.6.1.2.1.2.2.1.5’
Running ‘snmpbulkwalk -Cr10 -v2c -c public -m “” -M “” -t 3.50 -r 4 -Cc -OQ -OU -On -Ot worm001.dom.local .1.3.6.1.2.1.2.2.1.8’
Running ‘snmpbulkwalk -Cr10 -v2c -c public -m “” -M “” -t 3.50 -r 4 -Cc -OQ -OU -On -Ot worm001.dom.local .1.3.6.1.2.1.31.1.1.1.6’
Running ‘snmpbulkwalk -Cr10 -v2c -c public -m “” -M “” -t 3.50 -r 4 -Cc -OQ -OU -On -Ot worm001.dom.local .1.3.6.1.2.1.31.1.1.1.7’
Running ‘snmpbulkwalk -Cr10 -v2c -c public -m “” -M “” -t 3.50 -r 4 -Cc -OQ -OU -On -Ot worm001.dom.local .1.3.6.1.2.1.31.1.1.1.8’
Running ‘snmpbulkwalk -Cr10 -v2c -c public -m “” -M “” -t 3.50 -r 4 -Cc -OQ -OU -On -Ot worm001.dom.local .1.3.6.1.2.1.31.1.1.1.9’
Running ‘snmpbulkwalk -Cr10 -v2c -c public -m “” -M “” -t 3.50 -r 4 -Cc -OQ -OU -On -Ot worm001.dom.local .1.3.6.1.2.1.2.2.1.13’
Running ‘snmpbulkwalk -Cr10 -v2c -c public -m “” -M “” -t 3.50 -r 4 -Cc -OQ -OU -On -Ot worm001.dom.local .1.3.6.1.2.1.2.2.1.14’
Running ‘snmpbulkwalk -Cr10 -v2c -c public -m “” -M “” -t 3.50 -r 4 -Cc -OQ -OU -On -Ot worm001.dom.local .1.3.6.1.2.1.31.1.1.1.10’
Running ‘snmpbulkwalk -Cr10 -v2c -c public -m “” -M “” -t 3.50 -r 4 -Cc -OQ -OU -On -Ot worm001.dom.local .1.3.6.1.2.1.31.1.1.1.11’
Running ‘snmpbulkwalk -Cr10 -v2c -c public -m “” -M “” -t 3.50 -r 4 -Cc -OQ -OU -On -Ot worm001.dom.local .1.3.6.1.2.1.31.1.1.1.12’
Running ‘snmpbulkwalk -Cr10 -v2c -c public -m “” -M “” -t 3.50 -r 4 -Cc -OQ -OU -On -Ot worm001.dom.local .1.3.6.1.2.1.31.1.1.1.13’
Running ‘snmpbulkwalk -Cr10 -v2c -c public -m “” -M “” -t 3.50 -r 4 -Cc -OQ -OU -On -Ot worm001.dom.local .1.3.6.1.2.1.2.2.1.19’
Running ‘snmpbulkwalk -Cr10 -v2c -c public -m “” -M “” -t 3.50 -r 4 -Cc -OQ -OU -On -Ot worm001.dom.local .1.3.6.1.2.1.2.2.1.20’
Running ‘snmpbulkwalk -Cr10 -v2c -c public -m “” -M “” -t 3.50 -r 4 -Cc -OQ -OU -On -Ot worm001.dom.local .1.3.6.1.2.1.2.2.1.21’
Running ‘snmpbulkwalk -Cr10 -v2c -c public -m “” -M “” -t 3.50 -r 4 -Cc -OQ -OU -On -Ot worm001.dom.local .1.3.6.1.2.1.31.1.1.1.18’
Running ‘snmpbulkwalk -Cr10 -v2c -c public -m “” -M “” -t 3.50 -r 4 -Cc -OQ -OU -On -Ot worm001.dom.local .1.3.6.1.2.1.2.2.1.6’
Running ‘snmpbulkwalk -Cr10 -v2c -c public -m “” -M “” -t 3.50 -r 4 -Cc -OQ -OU -On -Ot worm001.dom.local .1.3.6.1.2.1.31.1.1.1.15’
snmp_info: Fetching data (SNMP walk cache is enabled: Use any locally cached information)
Running ‘snmpbulkwalk -Cr10 -v2c -c public -m “” -M “” -t 3.50 -r 4 -Cc -OQ -OU -On -Ot worm001.dom.local .1.3.6.1.2.1.1.1’
Running ‘snmpbulkwalk -Cr10 -v2c -c public -m “” -M “” -t 3.50 -r 4 -Cc -OQ -OU -On -Ot worm001.dom.local .1.3.6.1.2.1.1.4’
Running ‘snmpbulkwalk -Cr10 -v2c -c public -m “” -M “” -t 3.50 -r 4 -Cc -OQ -OU -On -Ot worm001.dom.local .1.3.6.1.2.1.1.5’
Running ‘snmpbulkwalk -Cr10 -v2c -c public -m “” -M “” -t 3.50 -r 4 -Cc -OQ -OU -On -Ot worm001.dom.local .1.3.6.1.2.1.1.6’
snmp_uptime: Fetching data (SNMP walk cache is enabled: Use any locally cached information)
Running ‘snmpbulkwalk -Cr10 -v2c -c public -m “” -M “” -t 3.50 -r 4 -Cc -OQ -OU -On -Ot worm001.dom.local .1.3.6.1.2.1.1.3’
Running ‘snmpbulkwalk -Cr10 -v2c -c public -m “” -M “” -t 3.50 -r 4 -Cc -OQ -OU -On -Ot worm001.dom.local .1.3.6.1.2.1.25.1.1’
ucd_diskio: Fetching data (SNMP walk cache is enabled: Use any locally cached information)
Running ‘snmpbulkwalk -Cr10 -v2c -c public -m “” -M “” -t 3.50 -r 4 -Cc -OQ -OU -On -Ot worm001.dom.local .1.3.6.1.4.1.2021.13.15.1.1.1’
Running ‘snmpbulkwalk -Cr10 -v2c -c public -m “” -M “” -t 3.50 -r 4 -Cc -OQ -OU -On -Ot worm001.dom.local .1.3.6.1.4.1.2021.13.15.1.1.2’
Running ‘snmpbulkwalk -Cr10 -v2c -c public -m “” -M “” -t 3.50 -r 4 -Cc -OQ -OU -On -Ot worm001.dom.local .1.3.6.1.4.1.2021.13.15.1.1.3’
Running ‘snmpbulkwalk -Cr10 -v2c -c public -m “” -M “” -t 3.50 -r 4 -Cc -OQ -OU -On -Ot worm001.dom.local .1.3.6.1.4.1.2021.13.15.1.1.4’
Running ‘snmpbulkwalk -Cr10 -v2c -c public -m “” -M “” -t 3.50 -r 4 -Cc -OQ -OU -On -Ot worm001.dom.local .1.3.6.1.4.1.2021.13.15.1.1.5’
Running ‘snmpbulkwalk -Cr10 -v2c -c public -m “” -M “” -t 3.50 -r 4 -Cc -OQ -OU -On -Ot worm001.dom.local .1.3.6.1.4.1.2021.13.15.1.1.6’
Write data to cache file /omd/sites/cmk01/tmp/check_mk/data_source_cache/snmp/checking/WORM001
Trying to acquire lock on /omd/sites/cmk01/tmp/check_mk/data_source_cache/snmp/checking/WORM001
Got lock on /omd/sites/cmk01/tmp/check_mk/data_source_cache/snmp/checking/WORM001
Releasing lock on /omd/sites/cmk01/tmp/check_mk/data_source_cache/snmp/checking/WORM001
Released lock on /omd/sites/cmk01/tmp/check_mk/data_source_cache/snmp/checking/WORM001
[cpu_tracking] Stop [7fcf07b79c70 - Snapshot(process=posix.times_result(user=0.050000000000000044, system=0.1, children_user=0.06, children_system=0.12, elapsed=0.45000000298023224))]
Source: SourceType.HOST/FetcherType.PIGGYBACK
[cpu_tracking] Start [7fcf07a8dfa0]
[PiggybackFetcher] Fetch with cache settings: NoCache(WORM001, base_path=/omd/sites/cmk01/tmp/check_mk/data_source_cache/piggyback, max_age=MaxAge(checking=0, discovery=120, inventory=120), disabled=True, use_outdated=False, simulation=False)
Not using cache (Cache usage disabled)
[PiggybackFetcher] Execute data source
No piggyback files for ‘WORM001’. Skip processing.
No piggyback files for ‘worm001.dom.local’. Skip processing.
Not using cache (Cache usage disabled)
[cpu_tracking] Stop [7fcf07a8dfa0 - Snapshot(process=posix.times_result(user=0.0, system=0.0, children_user=0.0, children_system=0.0, elapsed=0.0))] - PARSE FETCHER RESULTS
Source: SourceType.HOST/FetcherType.SNMP
No persisted sections
→ Add sections: [‘hr_cpu’, ‘hr_fs’, ‘hr_mem’, ‘if64’, ‘snmp_info’, ‘snmp_uptime’, ‘ucd_cpu_load’, ‘ucd_diskio’]
Source: SourceType.HOST/FetcherType.PIGGYBACK
No persisted sections
→ Add sections: []
Received no piggyback data
Received no piggyback data
[cpu_tracking] Start [7fcf07a1b730]
value store: synchronizing
Trying to acquire lock on /omd/sites/cmk01/tmp/check_mk/counters/WORM001
Got lock on /omd/sites/cmk01/tmp/check_mk/counters/WORM001
value store: loading from disk
Releasing lock on /omd/sites/cmk01/tmp/check_mk/counters/WORM001
Released lock on /omd/sites/cmk01/tmp/check_mk/counters/WORM001
CPU load 15 min load: 0.43, 15 min load per core: 0.43 (1 cores)
CPU utilization Total CPU: 8.5%
Disk IO dm-0 [45], Read: 0.00 B/s, Write: 0.00 B/s, Read operations: 0.00 1/s, Write operations: 0.00 1/s
Disk IO dm-1 [46], Read: 0.00 B/s, Write: 7.00 kB/s, Read operations: 0.00 1/s, Write operations: 1.71 1/s
Disk IO dm-10 [67], Read: 0.00 B/s, Write: 0.00 B/s, Read operations: 0.00 1/s, Write operations: 0.00 1/s
Disk IO dm-11 [68], Read: 0.00 B/s, Write: 0.00 B/s, Read operations: 0.00 1/s, Write operations: 0.00 1/s
Disk IO dm-12 [69], Read: 0.00 B/s, Write: 0.00 B/s, Read operations: 0.00 1/s, Write operations: 0.00 1/s
Disk IO dm-13 [70], Read: 0.00 B/s, Write: 0.00 B/s, Read operations: 0.00 1/s, Write operations: 0.00 1/s
Disk IO dm-14 [71], Read: 0.00 B/s, Write: 0.00 B/s, Read operations: 0.00 1/s, Write operations: 0.00 1/s
Disk IO dm-15 [72], Read: 0.00 B/s, Write: 0.00 B/s, Read operations: 0.00 1/s, Write operations: 0.00 1/s
Disk IO dm-16 [73], Read: 0.00 B/s, Write: 0.00 B/s, Read operations: 0.00 1/s, Write operations: 0.00 1/s
Disk IO dm-17 [74], Read: 0.00 B/s, Write: 0.00 B/s, Read operations: 0.00 1/s, Write operations: 0.00 1/s
Disk IO dm-18 [75], Read: 0.00 B/s, Write: 0.00 B/s, Read operations: 0.00 1/s, Write operations: 0.00 1/s
Disk IO dm-2 [47], Read: 0.00 B/s, Write: 0.00 B/s, Read operations: 0.00 1/s, Write operations: 0.00 1/s
Disk IO dm-3 [48], Read: 0.00 B/s, Write: 3.10 kB/s, Read operations: 0.00 1/s, Write operations: 0.69 1/s
Disk IO dm-4 [49], Read: 0.00 B/s, Write: 0.00 B/s, Read operations: 0.00 1/s, Write operations: 0.00 1/s
Disk IO dm-5 [50], Read: 0.00 B/s, Write: 0.00 B/s, Read operations: 0.00 1/s, Write operations: 0.00 1/s
Disk IO dm-6 [51], Read: 0.00 B/s, Write: 129.82 kB/s, Read operations: 0.00 1/s, Write operations: 10.21 1/s
Disk IO dm-7 [64], Read: 0.00 B/s, Write: 0.00 B/s, Read operations: 0.00 1/s, Write operations: 0.00 1/s
Disk IO dm-8 [65], Read: 0.00 B/s, Write: 0.00 B/s, Read operations: 0.00 1/s, Write operations: 0.00 1/s
Disk IO dm-9 [66], Read: 0.00 B/s, Write: 0.00 B/s, Read operations: 0.00 1/s, Write operations: 0.00 1/s
Disk IO loop0 [17], Read: 0.00 B/s, Write: 0.00 B/s, Read operations: 0.00 1/s, Write operations: 0.00 1/s
Disk IO loop1 [18], Read: 0.00 B/s, Write: 0.00 B/s, Read operations: 0.00 1/s, Write operations: 0.00 1/s
Disk IO loop2 [19], Read: 0.00 B/s, Write: 0.00 B/s, Read operations: 0.00 1/s, Write operations: 0.00 1/s
Disk IO loop3 [20], Read: 0.00 B/s, Write: 0.00 B/s, Read operations: 0.00 1/s, Write operations: 0.00 1/s
Disk IO loop4 [21], Read: 0.00 B/s, Write: 0.00 B/s, Read operations: 0.00 1/s, Write operations: 0.00 1/s
Disk IO loop5 [22], Read: 0.00 B/s, Write: 0.00 B/s, Read operations: 0.00 1/s, Write operations: 0.00 1/s
Disk IO loop6 [23], Read: 0.00 B/s, Write: 0.00 B/s, Read operations: 0.00 1/s, Write operations: 0.00 1/s
Disk IO loop7 [24], Read: 0.00 B/s, Write: 0.00 B/s, Read operations: 0.00 1/s, Write operations: 0.00 1/s
Disk IO nbd0 [25], Read: 0.00 B/s, Write: 0.00 B/s, Read operations: 0.00 1/s, Write operations: 0.00 1/s
Disk IO nbd1 [26], Read: 0.00 B/s, Write: 0.00 B/s, Read operations: 0.00 1/s, Write operations: 0.00 1/s
Disk IO nbd10 [35], Read: 0.00 B/s, Write: 0.00 B/s, Read operations: 0.00 1/s, Write operations: 0.00 1/s
Disk IO nbd11 [36], Read: 0.00 B/s, Write: 0.00 B/s, Read operations: 0.00 1/s, Write operations: 0.00 1/s
Disk IO nbd12 [37], Read: 0.00 B/s, Write: 0.00 B/s, Read operations: 0.00 1/s, Write operations: 0.00 1/s
Disk IO nbd13 [38], Read: 0.00 B/s, Write: 0.00 B/s, Read operations: 0.00 1/s, Write operations: 0.00 1/s
Disk IO nbd14 [39], Read: 0.00 B/s, Write: 0.00 B/s, Read operations: 0.00 1/s, Write operations: 0.00 1/s
Disk IO nbd15 [40], Read: 0.00 B/s, Write: 0.00 B/s, Read operations: 0.00 1/s, Write operations: 0.00 1/s
Disk IO nbd2 [27], Read: 0.00 B/s, Write: 0.00 B/s, Read operations: 0.00 1/s, Write operations: 0.00 1/s
Disk IO nbd3 [28], Read: 0.00 B/s, Write: 0.00 B/s, Read operations: 0.00 1/s, Write operations: 0.00 1/s
Disk IO nbd4 [29], Read: 0.00 B/s, Write: 0.00 B/s, Read operations: 0.00 1/s, Write operations: 0.00 1/s
Disk IO nbd5 [30], Read: 0.00 B/s, Write: 0.00 B/s, Read operations: 0.00 1/s, Write operations: 0.00 1/s
Disk IO nbd6 [31], Read: 0.00 B/s, Write: 0.00 B/s, Read operations: 0.00 1/s, Write operations: 0.00 1/s
Disk IO nbd7 [32], Read: 0.00 B/s, Write: 0.00 B/s, Read operations: 0.00 1/s, Write operations: 0.00 1/s
Disk IO nbd8 [33], Read: 0.00 B/s, Write: 0.00 B/s, Read operations: 0.00 1/s, Write operations: 0.00 1/s
Disk IO nbd9 [34], Read: 0.00 B/s, Write: 0.00 B/s, Read operations: 0.00 1/s, Write operations: 0.00 1/s
Disk IO ram0 [1], Read: 0.00 B/s, Write: 0.00 B/s, Read operations: 0.00 1/s, Write operations: 0.00 1/s
Disk IO ram1 [2], Read: 0.00 B/s, Write: 0.00 B/s, Read operations: 0.00 1/s, Write operations: 0.00 1/s
Disk IO ram10 [11], Read: 0.00 B/s, Write: 0.00 B/s, Read operations: 0.00 1/s, Write operations: 0.00 1/s
Disk IO ram11 [12], Read: 0.00 B/s, Write: 0.00 B/s, Read operations: 0.00 1/s, Write operations: 0.00 1/s
Disk IO ram12 [13], Read: 0.00 B/s, Write: 0.00 B/s, Read operations: 0.00 1/s, Write operations: 0.00 1/s
Disk IO ram13 [14], Read: 0.00 B/s, Write: 0.00 B/s, Read operations: 0.00 1/s, Write operations: 0.00 1/s
Disk IO ram14 [15], Read: 0.00 B/s, Write: 0.00 B/s, Read operations: 0.00 1/s, Write operations: 0.00 1/s
Disk IO ram15 [16], Read: 0.00 B/s, Write: 0.00 B/s, Read operations: 0.00 1/s, Write operations: 0.00 1/s
Disk IO ram2 [3], Read: 0.00 B/s, Write: 0.00 B/s, Read operations: 0.00 1/s, Write operations: 0.00 1/s
Disk IO ram3 [4], Read: 0.00 B/s, Write: 0.00 B/s, Read operations: 0.00 1/s, Write operations: 0.00 1/s
Disk IO ram4 [5], Read: 0.00 B/s, Write: 0.00 B/s, Read operations: 0.00 1/s, Write operations: 0.00 1/s
Disk IO ram5 [6], Read: 0.00 B/s, Write: 0.00 B/s, Read operations: 0.00 1/s, Write operations: 0.00 1/s
Disk IO ram6 [7], Read: 0.00 B/s, Write: 0.00 B/s, Read operations: 0.00 1/s, Write operations: 0.00 1/s
Disk IO ram7 [8], Read: 0.00 B/s, Write: 0.00 B/s, Read operations: 0.00 1/s, Write operations: 0.00 1/s
Disk IO ram8 [9], Read: 0.00 B/s, Write: 0.00 B/s, Read operations: 0.00 1/s, Write operations: 0.00 1/s
Disk IO ram9 [10], Read: 0.00 B/s, Write: 0.00 B/s, Read operations: 0.00 1/s, Write operations: 0.00 1/s
Disk IO sda [41], Read: 0.00 B/s, Write: 136.06 kB/s, Read operations: 0.00 1/s, Write operations: 8.27 1/s
Disk IO sda1 [42], Read: 0.00 B/s, Write: 0.00 B/s, Read operations: 0.00 1/s, Write operations: 0.00 1/s
Disk IO sda2 [43], Read: 0.00 B/s, Write: 0.00 B/s, Read operations: 0.00 1/s, Write operations: 0.00 1/s
Disk IO sda3 [44], Read: 0.00 B/s, Write: 136.06 kB/s, Read operations: 0.00 1/s, Write operations: 6.83 1/s
Disk IO sdb [52], Read: 0.00 B/s, Write: 0.00 B/s, Read operations: 0.00 1/s, Write operations: 0.00 1/s
Disk IO sdc [53], Read: 0.00 B/s, Write: 0.00 B/s, Read operations: 0.00 1/s, Write operations: 0.00 1/s
Disk IO sdd [54], Read: 0.00 B/s, Write: 0.00 B/s, Read operations: 0.00 1/s, Write operations: 0.00 1/s
Disk IO sde [55], Read: 0.00 B/s, Write: 0.00 B/s, Read operations: 0.00 1/s, Write operations: 0.00 1/s
Disk IO sdf [56], Read: 0.00 B/s, Write: 0.00 B/s, Read operations: 0.00 1/s, Write operations: 0.00 1/s
Disk IO sdg [57], Read: 0.00 B/s, Write: 0.00 B/s, Read operations: 0.00 1/s, Write operations: 0.00 1/s
Disk IO sdh [58], Read: 0.00 B/s, Write: 0.00 B/s, Read operations: 0.00 1/s, Write operations: 0.00 1/s
Disk IO sdi [59], Read: 0.00 B/s, Write: 0.00 B/s, Read operations: 0.00 1/s, Write operations: 0.00 1/s
Disk IO sdj [60], Read: 0.00 B/s, Write: 0.00 B/s, Read operations: 0.00 1/s, Write operations: 0.00 1/s
Disk IO sdk [61], Read: 0.00 B/s, Write: 0.00 B/s, Read operations: 0.00 1/s, Write operations: 0.00 1/s
Disk IO sdl [62], Read: 0.00 B/s, Write: 0.00 B/s, Read operations: 0.00 1/s, Write operations: 0.00 1/s
Disk IO sdm [63], Read: 0.00 B/s, Write: 0.00 B/s, Read operations: 0.00 1/s, Write operations: 0.00 1/s
Filesystem / 6.61% used (324.89 MB of 4.80 GB), trend: -6.81 kB / 24 hours
Filesystem /dev/shm 0.81% used (32.02 MB of 3.85 GB), trend: -13.61 MB / 24 hours
Filesystem /home 0.47% used (2.25 of 476.22 MB), trend: 0.00 B / 24 hours
Filesystem /opt 5.14% used (9.23 of 179.60 GB), trend: +21.75 MB / 24 hours - time left until disk full: more than a year
Filesystem /opt/fast/exports/zfs_mount/5b8c588f-7a23-448a-9539-5c1109de3e3a 3.35% used (21.46 of 640.11 GB), trend: -781.41 MB / 24 hours
Filesystem /run 1.1% used (8.68 of 789.12 MB), trend: -40.86 kB / 24 hours
Filesystem /sys/fs/cgroup 0% used (0.00 B of 10.00 MB), trend: 0.00 B / 24 hours
Filesystem /tmp 0.53% used (2.53 of 476.22 MB), trend: +746.10 B / 24 hours - time left until disk full: more than a year
Filesystem /usr 65.8% used (5.10 of 7.75 GB), trend: 0.00 B / 24 hours
Filesystem /var 38.81% used (1.12 of 2.89 GB), trend: +2.17 MB / 24 hours - time left until disk full: more than a year
Interface 03 [eno1], (up), MAC: 00:13:95:31:62:C6, Speed: 1 GBit/s, In: 447 B/s (<0.01%), Out: 1.11 kB/s (<0.01%)
Interface 07 [ethfc1], (up), MAC: 00:0F:8D:D0:22:13, Speed: 100 MBit/s, In: 2.90 kB/s (0.02%), Out: 2.89 kB/s (0.02%)
Interface 10 [vctrlext], (up), MAC: 00:0F:8D:D0:22:13, Speed: 100 MBit/s, In: 2.90 kB/s (0.02%), Out: 2.89 kB/s (0.02%)
Interface 11 [vmgmt], (up), MAC: 00:13:95:31:62:C6, Speed: 1 GBit/s, In: 447 B/s (<0.01%), Out: 1.11 kB/s (<0.01%)
Memory used Total (RAM + Swap): 124.79% - 9.62 GiB of 7.71 GiB RAM, RAM: 88.13% - 6.79 GiB of 7.71 GiB, Swap: 35.32% - 2.83 GiB of 8.00 GiB
SNMP Info Linux worm001 5.4.109-gentoo-FAST #1 SMP Mon Aug 23 09:35:51 CEST 2021 x86_64, worm001, Sitting on the Dock of the Bay, Me me@example.org
Uptime Up since Oct 14 2022 16:01:55, Uptime: 39 days 19 hours
No piggyback files for ‘WORM001’. Skip processing.
No piggyback files for ‘worm001.dom.local’. Skip processing.
[cpu_tracking] Stop [7fcf07a1b730 - Snapshot(process=posix.times_result(user=0.06000000000000005, system=0.0, children_user=0.0, children_system=0.0, elapsed=0.05999999865889549))]
[snmp] Success, execution time 0.5 sec | execution_time=0.510 user_time=0.110 system_time=0.100 children_user_time=0.060 children_system_time=0.120 cmk_time_snmp=0.120 cmk_time_agent=0.000