I have a total of 6 hosts which i want to monitor with ILO.
5 of them are working correctly and one isn’t working correctly.
They have the same community setting. They are in the same subnet with the same firewall rule.
They are all the same model HP server with the same ILO version and firmware version.
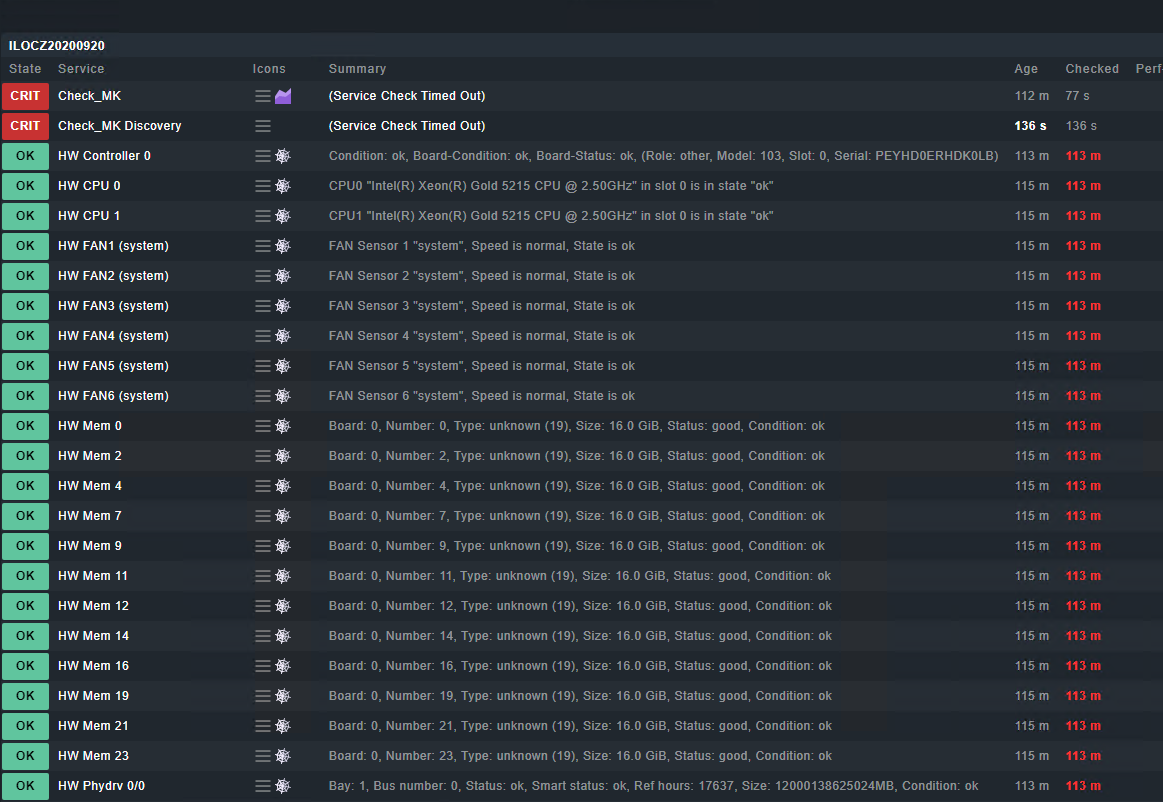
When i add the host in my CheckMK server it is able to discover all the services correctly. After this the Check_MK Discovery and Check_MK service just show: (Service Check Timed Out)
With a mib browser i am able to read SNMP data.
From the CHECKMK server i am able to read out SNMP data with the following command:
time snmpwalk -v1 c slimstock -m “” -M “” -Cc -OQ -OU -On -Ot [IP address] .1.3.6.1.2.1.2.2.1.16
I see SNMP data and the time it takes is about 3.6 seconds.
I’ve deleted and added the host multiple times. I’ve tried snmp v1 & snmp v2 with the same result.
I’m not sure what else i can try, any help is appreciated
Checkmk version 2.1.0
Try license usage history update.
Trying to acquire lock on /omd/sites/monitoring/var/check_mk/license_usage/next_run
Got lock on /omd/sites/monitoring/var/check_mk/license_usage/next_run
Trying to acquire lock on /omd/sites/monitoring/var/check_mk/license_usage/history.json
Got lock on /omd/sites/monitoring/var/check_mk/license_usage/history.json
Next run time has not been reached yet. Abort.
Releasing lock on /omd/sites/monitoring/var/check_mk/license_usage/history.json
Released lock on /omd/sites/monitoring/var/check_mk/license_usage/history.json
Releasing lock on /omd/sites/monitoring/var/check_mk/license_usage/next_run
Released lock on /omd/sites/monitoring/var/check_mk/license_usage/next_run
+ FETCHING DATA
  Source: SourceType.HOST/FetcherType.SNMP
[cpu_tracking] Start [7f070b4dea30]
[SNMPFetcher] Fetch with cache settings: SNMPFileCache(ILO-BACKUP01, base_path=/omd/sites/monitoring/tmp/check_mk/data_source_cache/snmp, max_age=MaxAge(checking=0, discovery=120, inventory=120), disabled=False, use_outdated=False, simulation=False)
Not using cache (Too old. Age is 94618 sec, allowed is 0 sec)
[SNMPFetcher] Execute data source
  SNMP scan:
       Getting OID .1.3.6.1.2.1.1.1.0: Running 'snmpget -v1 -c slimstock -m "" -M "" -t 60.00 -r 5 -On -OQ -Oe -Ot 10.131.99.25 .1.3.6.1.2.1.1.1.0'
SNMP answer: ==> ["Integrated Lights-Out 5 2.65 Feb 23 2022"]
b'Integrated Lights-Out 5 2.65 Feb 23 2022'
       Getting OID .1.3.6.1.2.1.1.2.0: Running 'snmpget -v1 -c slimstock -m "" -M "" -t 60.00 -r 5 -On -OQ -Oe -Ot 10.131.99.25 .1.3.6.1.2.1.1.2.0'
SNMP answer: ==> [.1.3.6.1.4.1.232.9.4.11]
b'.1.3.6.1.4.1.232.9.4.11'
       Using cached OID .1.3.6.1.2.1.1.2.0: '.1.3.6.1.4.1.232.9.4.11'
       Using cached OID .1.3.6.1.2.1.1.2.0: '.1.3.6.1.4.1.232.9.4.11'
       Using cached OID .1.3.6.1.2.1.1.1.0: 'Integrated Lights-Out 5 2.65 Feb 23 2022'
       Using cached OID .1.3.6.1.2.1.1.1.0: 'Integrated Lights-Out 5 2.65 Feb 23 2022'
       Using cached OID .1.3.6.1.2.1.1.1.0: 'Integrated Lights-Out 5 2.65 Feb 23 2022'
       Using cached OID .1.3.6.1.2.1.1.1.0: 'Integrated Lights-Out 5 2.65 Feb 23 2022'
       Using cached OID .1.3.6.1.2.1.1.1.0: 'Integrated Lights-Out 5 2.65 Feb 23 2022'
       Using cached OID .1.3.6.1.2.1.1.1.0: 'Integrated Lights-Out 5 2.65 Feb 23 2022'
       Getting OID .1.3.6.1.2.1.2.2.1.*: Running 'snmpgetnext -Cf -v1 -c slimstock -m "" -M "" -t 60.00 -r 5 -On -OQ -Oe -Ot 10.131.99.25 .1.3.6.1.2.1.2.2.1'
SNMP answer: ==> [1]
b'1'
       Using cached OID .1.3.6.1.2.1.1.1.0: 'Integrated Lights-Out 5 2.65 Feb 23 2022'
   SNMP scan found                    if snmp_uptime
Trying to acquire lock on /omd/sites/monitoring/tmp/check_mk/snmp_scan_cache/ILO-BACKUP01.10.131.99.25
Got lock on /omd/sites/monitoring/tmp/check_mk/snmp_scan_cache/ILO-BACKUP01.10.131.99.25
Releasing lock on /omd/sites/monitoring/tmp/check_mk/snmp_scan_cache/ILO-BACKUP01.10.131.99.25
Released lock on /omd/sites/monitoring/tmp/check_mk/snmp_scan_cache/ILO-BACKUP01.10.131.99.25
hp_proliant_cpu: Fetching data (SNMP walk cache is enabled: Use any locally cached information)
Running 'snmpwalk -v1 -c slimstock -m "" -M "" -t 60.00 -r 5 -Cc -OQ -OU -On -Ot 10.131.99.25 .1.3.6.1.4.1.232.1.2.2.1.1.1'
Running 'snmpwalk -v1 -c slimstock -m "" -M "" -t 60.00 -r 5 -Cc -OQ -OU -On -Ot 10.131.99.25 .1.3.6.1.4.1.232.1.2.2.1.1.2'
Running 'snmpwalk -v1 -c slimstock -m "" -M "" -t 60.00 -r 5 -Cc -OQ -OU -On -Ot 10.131.99.25 .1.3.6.1.4.1.232.1.2.2.1.1.3'
Running 'snmpwalk -v1 -c slimstock -m "" -M "" -t 60.00 -r 5 -Cc -OQ -OU -On -Ot 10.131.99.25 .1.3.6.1.4.1.232.1.2.2.1.1.6'
hp_proliant_da_cntlr: Fetching data (SNMP walk cache is enabled: Use any locally cached information)
Running 'snmpwalk -v1 -c slimstock -m "" -M "" -t 60.00 -r 5 -Cc -OQ -OU -On -Ot 10.131.99.25 .1.3.6.1.4.1.232.3.2.2.1.1.1'
Running 'snmpwalk -v1 -c slimstock -m "" -M "" -t 60.00 -r 5 -Cc -OQ -OU -On -Ot 10.131.99.25 .1.3.6.1.4.1.232.3.2.2.1.1.2'
Running 'snmpwalk -v1 -c slimstock -m "" -M "" -t 60.00 -r 5 -Cc -OQ -OU -On -Ot 10.131.99.25 .1.3.6.1.4.1.232.3.2.2.1.1.5'
Running 'snmpwalk -v1 -c slimstock -m "" -M "" -t 60.00 -r 5 -Cc -OQ -OU -On -Ot 10.131.99.25 .1.3.6.1.4.1.232.3.2.2.1.1.6'
Running 'snmpwalk -v1 -c slimstock -m "" -M "" -t 60.00 -r 5 -Cc -OQ -OU -On -Ot 10.131.99.25 .1.3.6.1.4.1.232.3.2.2.1.1.9'
Running 'snmpwalk -v1 -c slimstock -m "" -M "" -t 60.00 -r 5 -Cc -OQ -OU -On -Ot 10.131.99.25 .1.3.6.1.4.1.232.3.2.2.1.1.10'
Running 'snmpwalk -v1 -c slimstock -m "" -M "" -t 60.00 -r 5 -Cc -OQ -OU -On -Ot 10.131.99.25 .1.3.6.1.4.1.232.3.2.2.1.1.12'
Running 'snmpwalk -v1 -c slimstock -m "" -M "" -t 60.00 -r 5 -Cc -OQ -OU -On -Ot 10.131.99.25 .1.3.6.1.4.1.232.3.2.2.1.1.15'
hp_proliant_da_phydrv: Fetching data (SNMP walk cache is enabled: Use any locally cached information)
Running 'snmpwalk -v1 -c slimstock -m "" -M "" -t 60.00 -r 5 -Cc -OQ -OU -On -Ot 10.131.99.25 .1.3.6.1.4.1.232.3.2.5.1.1.1'
Running 'snmpwalk -v1 -c slimstock -m "" -M "" -t 60.00 -r 5 -Cc -OQ -OU -On -Ot 10.131.99.25 .1.3.6.1.4.1.232.3.2.5.1.1.2'
Running 'snmpwalk -v1 -c slimstock -m "" -M "" -t 60.00 -r 5 -Cc -OQ -OU -On -Ot 10.131.99.25 .1.3.6.1.4.1.232.3.2.5.1.1.5'
Running 'snmpwalk -v1 -c slimstock -m "" -M "" -t 60.00 -r 5 -Cc -OQ -OU -On -Ot 10.131.99.25 .1.3.6.1.4.1.232.3.2.5.1.1.6'
Running 'snmpwalk -v1 -c slimstock -m "" -M "" -t 60.00 -r 5 -Cc -OQ -OU -On -Ot 10.131.99.25 .1.3.6.1.4.1.232.3.2.5.1.1.9'
Running 'snmpwalk -v1 -c slimstock -m "" -M "" -t 60.00 -r 5 -Cc -OQ -OU -On -Ot 10.131.99.25 .1.3.6.1.4.1.232.3.2.5.1.1.45'
Running 'snmpwalk -v1 -c slimstock -m "" -M "" -t 60.00 -r 5 -Cc -OQ -OU -On -Ot 10.131.99.25 .1.3.6.1.4.1.232.3.2.5.1.1.37'
Running 'snmpwalk -v1 -c slimstock -m "" -M "" -t 60.00 -r 5 -Cc -OQ -OU -On -Ot 10.131.99.25 .1.3.6.1.4.1.232.3.2.5.1.1.50'
Running 'snmpwalk -v1 -c slimstock -m "" -M "" -t 60.00 -r 5 -Cc -OQ -OU -On -Ot 10.131.99.25 .1.3.6.1.4.1.232.3.2.5.1.1.57'
Running 'snmpwalk -v1 -c slimstock -m "" -M "" -t 60.00 -r 5 -Cc -OQ -OU -On -Ot 10.131.99.25 .1.3.6.1.4.1.232.3.2.5.1.1.3'
Running 'snmpwalk -v1 -c slimstock -m "" -M "" -t 60.00 -r 5 -Cc -OQ -OU -On -Ot 10.131.99.25 .1.3.6.1.4.1.232.3.2.5.1.1.51'
Running 'snmpwalk -v1 -c slimstock -m "" -M "" -t 60.00 -r 5 -Cc -OQ -OU -On -Ot 10.131.99.25 .1.3.6.1.4.1.232.3.2.5.1.1.60'
Running 'snmpwalk -v1 -c slimstock -m "" -M "" -t 60.00 -r 5 -Cc -OQ -OU -On -Ot 10.131.99.25 .1.3.6.1.4.1.232.3.2.5.1.1.4'
hp_proliant_fans: Fetching data (SNMP walk cache is enabled: Use any locally cached information)
Running 'snmpwalk -v1 -c slimstock -m "" -M "" -t 60.00 -r 5 -Cc -OQ -OU -On -Ot 10.131.99.25 .1.3.6.1.4.1.232.6.2.6.7.1.2'
Running 'snmpwalk -v1 -c slimstock -m "" -M "" -t 60.00 -r 5 -Cc -OQ -OU -On -Ot 10.131.99.25 .1.3.6.1.4.1.232.6.2.6.7.1.3'
Running 'snmpwalk -v1 -c slimstock -m "" -M "" -t 60.00 -r 5 -Cc -OQ -OU -On -Ot 10.131.99.25 .1.3.6.1.4.1.232.6.2.6.7.1.4'
Running 'snmpwalk -v1 -c slimstock -m "" -M "" -t 60.00 -r 5 -Cc -OQ -OU -On -Ot 10.131.99.25 .1.3.6.1.4.1.232.6.2.6.7.1.6'
Running 'snmpwalk -v1 -c slimstock -m "" -M "" -t 60.00 -r 5 -Cc -OQ -OU -On -Ot 10.131.99.25 .1.3.6.1.4.1.232.6.2.6.7.1.9'
Running 'snmpwalk -v1 -c slimstock -m "" -M "" -t 60.00 -r 5 -Cc -OQ -OU -On -Ot 10.131.99.25 .1.3.6.1.4.1.232.6.2.6.7.1.12'
hp_proliant_mem: Fetching data (SNMP walk cache is enabled: Use any locally cached information)
Running 'snmpwalk -v1 -c slimstock -m "" -M "" -t 60.00 -r 5 -Cc -OQ -OU -On -Ot 10.131.99.25 .1.3.6.1.4.1.232.6.2.14.13.1.1'
Running 'snmpwalk -v1 -c slimstock -m "" -M "" -t 60.00 -r 5 -Cc -OQ -OU -On -Ot 10.131.99.25 .1.3.6.1.4.1.232.6.2.14.13.1.2'
Running 'snmpwalk -v1 -c slimstock -m "" -M "" -t 60.00 -r 5 -Cc -OQ -OU -On -Ot 10.131.99.25 .1.3.6.1.4.1.232.6.2.14.13.1.3'
Running 'snmpwalk -v1 -c slimstock -m "" -M "" -t 60.00 -r 5 -Cc -OQ -OU -On -Ot 10.131.99.25 .1.3.6.1.4.1.232.6.2.14.13.1.6'
Running 'snmpwalk -v1 -c slimstock -m "" -M "" -t 60.00 -r 5 -Cc -OQ -OU -On -Ot 10.131.99.25 .1.3.6.1.4.1.232.6.2.14.13.1.7'
Running 'snmpwalk -v1 -c slimstock -m "" -M "" -t 60.00 -r 5 -Cc -OQ -OU -On -Ot 10.131.99.25 .1.3.6.1.4.1.232.6.2.14.13.1.12'
Running 'snmpwalk -v1 -c slimstock -m "" -M "" -t 60.00 -r 5 -Cc -OQ -OU -On -Ot 10.131.99.25 .1.3.6.1.4.1.232.6.2.14.13.1.19'
Running 'snmpwalk -v1 -c slimstock -m "" -M "" -t 60.00 -r 5 -Cc -OQ -OU -On -Ot 10.131.99.25 .1.3.6.1.4.1.232.6.2.14.13.1.20'
hp_proliant_power: Fetching data (SNMP walk cache is enabled: Use any locally cached information)
Running 'snmpwalk -v1 -c slimstock -m "" -M "" -t 60.00 -r 5 -Cc -OQ -OU -On -Ot 10.131.99.25 .1.3.6.1.4.1.232.6.2.15.2'
Running 'snmpwalk -v1 -c slimstock -m "" -M "" -t 60.00 -r 5 -Cc -OQ -OU -On -Ot 10.131.99.25 .1.3.6.1.4.1.232.6.2.15.3'
hp_proliant_psu: Fetching data (SNMP walk cache is enabled: Use any locally cached information)
Running 'snmpwalk -v1 -c slimstock -m "" -M "" -t 60.00 -r 5 -Cc -OQ -OU -On -Ot 10.131.99.25 .1.3.6.1.4.1.232.6.2.9.3.1.1'
Running 'snmpwalk -v1 -c slimstock -m "" -M "" -t 60.00 -r 5 -Cc -OQ -OU -On -Ot 10.131.99.25 .1.3.6.1.4.1.232.6.2.9.3.1.2'
Running 'snmpwalk -v1 -c slimstock -m "" -M "" -t 60.00 -r 5 -Cc -OQ -OU -On -Ot 10.131.99.25 .1.3.6.1.4.1.232.6.2.9.3.1.3'
Running 'snmpwalk -v1 -c slimstock -m "" -M "" -t 60.00 -r 5 -Cc -OQ -OU -On -Ot 10.131.99.25 .1.3.6.1.4.1.232.6.2.9.3.1.4'
Running 'snmpwalk -v1 -c slimstock -m "" -M "" -t 60.00 -r 5 -Cc -OQ -OU -On -Ot 10.131.99.25 .1.3.6.1.4.1.232.6.2.9.3.1.7'
Running 'snmpwalk -v1 -c slimstock -m "" -M "" -t 60.00 -r 5 -Cc -OQ -OU -On -Ot 10.131.99.25 .1.3.6.1.4.1.232.6.2.9.3.1.8'
hp_proliant_raid: Fetching data (SNMP walk cache is enabled: Use any locally cached information)
Running 'snmpwalk -v1 -c slimstock -m "" -M "" -t 60.00 -r 5 -Cc -OQ -OU -On -Ot 10.131.99.25 .1.3.6.1.4.1.232.3.2.3.1.1.2'
Running 'snmpwalk -v1 -c slimstock -m "" -M "" -t 60.00 -r 5 -Cc -OQ -OU -On -Ot 10.131.99.25 .1.3.6.1.4.1.232.3.2.3.1.1.14'
Running 'snmpwalk -v1 -c slimstock -m "" -M "" -t 60.00 -r 5 -Cc -OQ -OU -On -Ot 10.131.99.25 .1.3.6.1.4.1.232.3.2.3.1.1.4'
Running 'snmpwalk -v1 -c slimstock -m "" -M "" -t 60.00 -r 5 -Cc -OQ -OU -On -Ot 10.131.99.25 .1.3.6.1.4.1.232.3.2.3.1.1.9'
Running 'snmpwalk -v1 -c slimstock -m "" -M "" -t 60.00 -r 5 -Cc -OQ -OU -On -Ot 10.131.99.25 .1.3.6.1.4.1.232.3.2.3.1.1.12'
hp_proliant_temp: Fetching data (SNMP walk cache is enabled: Use any locally cached information)
Running 'snmpwalk -v1 -c slimstock -m "" -M "" -t 60.00 -r 5 -Cc -OQ -OU -On -Ot 10.131.99.25 .1.3.6.1.4.1.232.6.2.6.8.1.2'
Running 'snmpwalk -v1 -c slimstock -m "" -M "" -t 60.00 -r 5 -Cc -OQ -OU -On -Ot 10.131.99.25 .1.3.6.1.4.1.232.6.2.6.8.1.3'
Running 'snmpwalk -v1 -c slimstock -m "" -M "" -t 60.00 -r 5 -Cc -OQ -OU -On -Ot 10.131.99.25 .1.3.6.1.4.1.232.6.2.6.8.1.4'
Running 'snmpwalk -v1 -c slimstock -m "" -M "" -t 60.00 -r 5 -Cc -OQ -OU -On -Ot 10.131.99.25 .1.3.6.1.4.1.232.6.2.6.8.1.5'
Running 'snmpwalk -v1 -c slimstock -m "" -M "" -t 60.00 -r 5 -Cc -OQ -OU -On -Ot 10.131.99.25 .1.3.6.1.4.1.232.6.2.6.8.1.6'
if: Fetching data (SNMP walk cache is enabled: Use any locally cached information)
Running 'snmpwalk -v1 -c slimstock -m "" -M "" -t 60.00 -r 5 -Cc -OQ -OU -On -Ot 10.131.99.25 .1.3.6.1.2.1.2.2.1.1'
Running 'snmpwalk -v1 -c slimstock -m "" -M "" -t 60.00 -r 5 -Cc -OQ -OU -On -Ot 10.131.99.25 .1.3.6.1.2.1.2.2.1.2'
Running 'snmpwalk -v1 -c slimstock -m "" -M "" -t 60.00 -r 5 -Cc -OQ -OU -On -Ot 10.131.99.25 .1.3.6.1.2.1.2.2.1.3'
^C[cpu_tracking] Stop [7f070b4dea30 - Snapshot(process=posix.times_result(user=0.050000000000000044, system=0.09000000000000001, children_user=0.08, children_system=0.09, elapsed=34.35999999940395))]
  Source: SourceType.HOST/FetcherType.PIGGYBACK
[cpu_tracking] Start [7f070b4defd0]
[PiggybackFetcher] Fetch with cache settings: NoCache(ILO-BACKUP01, base_path=/omd/sites/monitoring/tmp/check_mk/data_source_cache/piggyback, max_age=MaxAge(checking=0, discovery=120, inventory=120), disabled=True, use_outdated=False, simulation=False)
Not using cache (Cache usage disabled)
[PiggybackFetcher] Execute data source
No piggyback files for 'ILO-BACKUP01'. Skip processing.
No piggyback files for '10.131.99.25'. Skip processing.
Not using cache (Cache usage disabled)
[cpu_tracking] Stop [7f070b4defd0 - Snapshot(process=posix.times_result(user=0.0, system=0.0, children_user=0.0, children_system=0.0, elapsed=0.0))]
+ PARSE FETCHER RESULTS
  Source: SourceType.HOST/FetcherType.SNMP
  -> Not adding sections: MKTerminate
  Source: SourceType.HOST/FetcherType.PIGGYBACK
No persisted sections
  -> Add sections: []
Received no piggyback data
Received no piggyback data
[cpu_tracking] Start [7f070b4de250]
value store: synchronizing
Trying to acquire lock on /omd/sites/monitoring/tmp/check_mk/counters/ILO-BACKUP01
Got lock on /omd/sites/monitoring/tmp/check_mk/counters/ILO-BACKUP01
value store: loading from disk
Releasing lock on /omd/sites/monitoring/tmp/check_mk/counters/ILO-BACKUP01
Released lock on /omd/sites/monitoring/tmp/check_mk/counters/ILO-BACKUP01
HW CPU 0             PEND - Check plugin received no monitoring data
HW CPU 1             PEND - Check plugin received no monitoring data
HW Controller 0      PEND - Check plugin received no monitoring data
HW FAN1 (system)     PEND - Check plugin received no monitoring data
HW FAN2 (system)     PEND - Check plugin received no monitoring data
HW FAN3 (system)     PEND - Check plugin received no monitoring data
HW FAN4 (system)     PEND - Check plugin received no monitoring data
HW FAN5 (system)     PEND - Check plugin received no monitoring data
HW FAN6 (system)     PEND - Check plugin received no monitoring data
HW Mem 0             PEND - Check plugin received no monitoring data
HW Mem 11            PEND - Check plugin received no monitoring data
HW Mem 12            PEND - Check plugin received no monitoring data
HW Mem 14            PEND - Check plugin received no monitoring data
HW Mem 16            PEND - Check plugin received no monitoring data
HW Mem 19            PEND - Check plugin received no monitoring data
HW Mem 2             PEND - Check plugin received no monitoring data
HW Mem 21            PEND - Check plugin received no monitoring data
HW Mem 23            PEND - Check plugin received no monitoring data
HW Mem 4             PEND - Check plugin received no monitoring data
HW Mem 7             PEND - Check plugin received no monitoring data
HW Mem 9             PEND - Check plugin received no monitoring data
HW PSU 0/1           PEND - Check plugin received no monitoring data
HW PSU 0/2           PEND - Check plugin received no monitoring data
HW PSU Total         PEND - Check plugin received no monitoring data
HW Phydrv 0/0        PEND - Check plugin received no monitoring data
HW Phydrv 0/1        PEND - Check plugin received no monitoring data
HW Phydrv 0/12       PEND - Check plugin received no monitoring data
HW Phydrv 0/14       PEND - Check plugin received no monitoring data
HW Phydrv 0/2        PEND - Check plugin received no monitoring data
HW Phydrv 0/3        PEND - Check plugin received no monitoring data
HW Phydrv 0/4        PEND - Check plugin received no monitoring data
HW Phydrv 0/5        PEND - Check plugin received no monitoring data
HW Phydrv 0/6        PEND - Check plugin received no monitoring data
HW Phydrv 0/7        PEND - Check plugin received no monitoring data
HW Power Meter       PEND - Check plugin received no monitoring data
Interface 02         PEND - Check plugin received no monitoring data
Interface 04         PEND - Check plugin received no monitoring data
Interface 09         PEND - Check plugin received no monitoring data
Interface 12         PEND - Check plugin received no monitoring data
Interface 16         PEND - Check plugin received no monitoring data
Interface 18         PEND - Check plugin received no monitoring data
Interface 19         PEND - Check plugin received no monitoring data
Interface 20         PEND - Check plugin received no monitoring data
Interface 21         PEND - Check plugin received no monitoring data
Interface 37         PEND - Check plugin received no monitoring data
Interface 38         PEND - Check plugin received no monitoring data
Interface 39         PEND - Check plugin received no monitoring data
Interface 40         PEND - Check plugin received no monitoring data
Interface 41         PEND - Check plugin received no monitoring data
Interface 42         PEND - Check plugin received no monitoring data
Interface 43         PEND - Check plugin received no monitoring data
Interface 44         PEND - Check plugin received no monitoring data
Interface 45         PEND - Check plugin received no monitoring data
Interface 46         PEND - Check plugin received no monitoring data
Interface 47         PEND - Check plugin received no monitoring data
Interface 49         PEND - Check plugin received no monitoring data
Interface 50         PEND - Check plugin received no monitoring data
Interface 51         PEND - Check plugin received no monitoring data
Interface 52         PEND - Check plugin received no monitoring data
Interface 53         PEND - Check plugin received no monitoring data
Interface 54         PEND - Check plugin received no monitoring data
Interface 55         PEND - Check plugin received no monitoring data
Interface 56         PEND - Check plugin received no monitoring data
Interface 57         PEND - Check plugin received no monitoring data
Interface 58         PEND - Check plugin received no monitoring data
Logical Device       PEND - Check plugin received no monitoring data
Logical Device 2     PEND - Check plugin received no monitoring data
SNMP Info            PEND - Check plugin received no monitoring data
Temperature 1 (ambient) PEND - Check plugin received no monitoring data
Temperature 10 (memory) PEND - Check plugin received no monitoring data
Temperature 12 (system) PEND - Check plugin received no monitoring data
Temperature 14 (system) PEND - Check plugin received no monitoring data
Temperature 15 (ambient) PEND - Check plugin received no monitoring data
Temperature 16 (system) PEND - Check plugin received no monitoring data
Temperature 17 (system) PEND - Check plugin received no monitoring data
Temperature 18 (system) PEND - Check plugin received no monitoring data
Temperature 19 (system) PEND - Check plugin received no monitoring data
Temperature 2 (cpu)  PEND - Check plugin received no monitoring data
Temperature 20 (system) PEND - Check plugin received no monitoring data
Temperature 21 (system) PEND - Check plugin received no monitoring data
Temperature 22 (system) PEND - Check plugin received no monitoring data
Temperature 23 (system) PEND - Check plugin received no monitoring data
Temperature 24 (system) PEND - Check plugin received no monitoring data
Temperature 25 (system) PEND - Check plugin received no monitoring data
Temperature 26 (system) PEND - Check plugin received no monitoring data
Temperature 27 (system) PEND - Check plugin received no monitoring data
Temperature 28 (ioBoard) PEND - Check plugin received no monitoring data
Temperature 29 (ioBoard) PEND - Check plugin received no monitoring data
Temperature 3 (cpu)  PEND - Check plugin received no monitoring data
Temperature 30 (ioBoard) PEND - Check plugin received no monitoring data
Temperature 31 (ioBoard) PEND - Check plugin received no monitoring data
Temperature 33 (ioBoard) PEND - Check plugin received no monitoring data
Temperature 35 (ioBoard) PEND - Check plugin received no monitoring data
Temperature 37 (ioBoard) PEND - Check plugin received no monitoring data
Temperature 4 (memory) PEND - Check plugin received no monitoring data
Temperature 40 (system) PEND - Check plugin received no monitoring data
Temperature 43 (system) PEND - Check plugin received no monitoring data
Temperature 44 (powerSupply) PEND - Check plugin received no monitoring data
Temperature 45 (powerSupply) PEND - Check plugin received no monitoring data
Temperature 46 (powerSupply) PEND - Check plugin received no monitoring data
Temperature 47 (powerSupply) PEND - Check plugin received no monitoring data
Temperature 48 (powerSupply) PEND - Check plugin received no monitoring data
Temperature 49 (powerSupply) PEND - Check plugin received no monitoring data
Temperature 6 (memory) PEND - Check plugin received no monitoring data
Temperature 67 (cpu) PEND - Check plugin received no monitoring data
Temperature 68 (cpu) PEND - Check plugin received no monitoring data
Temperature 8 (memory) PEND - Check plugin received no monitoring data
Uptime               PEND - Check plugin received no monitoring data
value store: synchronizing
Trying to acquire lock on /omd/sites/monitoring/tmp/check_mk/counters/ILO-BACKUP01
Got lock on /omd/sites/monitoring/tmp/check_mk/counters/ILO-BACKUP01
value store: already loaded
Releasing lock on /omd/sites/monitoring/tmp/check_mk/counters/ILO-BACKUP01
Released lock on /omd/sites/monitoring/tmp/check_mk/counters/ILO-BACKUP01
No piggyback files for 'ILO-BACKUP01'. Skip processing.
No piggyback files for '10.131.99.25'. Skip processing.
[cpu_tracking] Stop [7f070b4de250 - Snapshot(process=posix.times_result(user=0.0, system=0.0, children_user=0.0, children_system=0.0, elapsed=0.009999997913837433))]
[snmp] MKTerminate(!!), Got no information from host(!!), execution time 34.4 sec | execution_time=34.370 user_time=0.050 system_time=0.090 children_user_time=0.080 children_system_time=0.090 cmk_time_snmp=34.050 cmk_time_agent=0.000
Oh and i forgot to mention, as an extra test i also created a SNMP rule specifically for this host with: Response timeout for a single query: 60 seconds with 5 retries, just to make sure it wasn’t a timeout issue.
No, not really. Something is definitely weird: Got no information from host(!!) in the last line and Check plugin received no monitoring data at all the Services. If it can find it at the other hosts, it should just work fine with this one (MIBs are right).
I did a restart/reset of my ILO without any success.
I’ve just created a Normal check interval for service checks rule with a 3 minutes check time specifically for this host. Let’s see if this works.
Does it find the Services if you do a “Remove all and find new” in the service configuration? Today I had problems with SNMP Host that were in stale and this fixed it.
@paulr282 I’ve just done a Remove all and find new. I’m not sure if it’s normal but finding the services on this ILO host also takes about 100 seconds. For other SNMP servers this time is only about 12 seconds. I think there might be some timeout issues.
Sadly after performing the Remove all and find new all the services still stay on the same state as the above picture. On the Services of host screen it did find all the services.
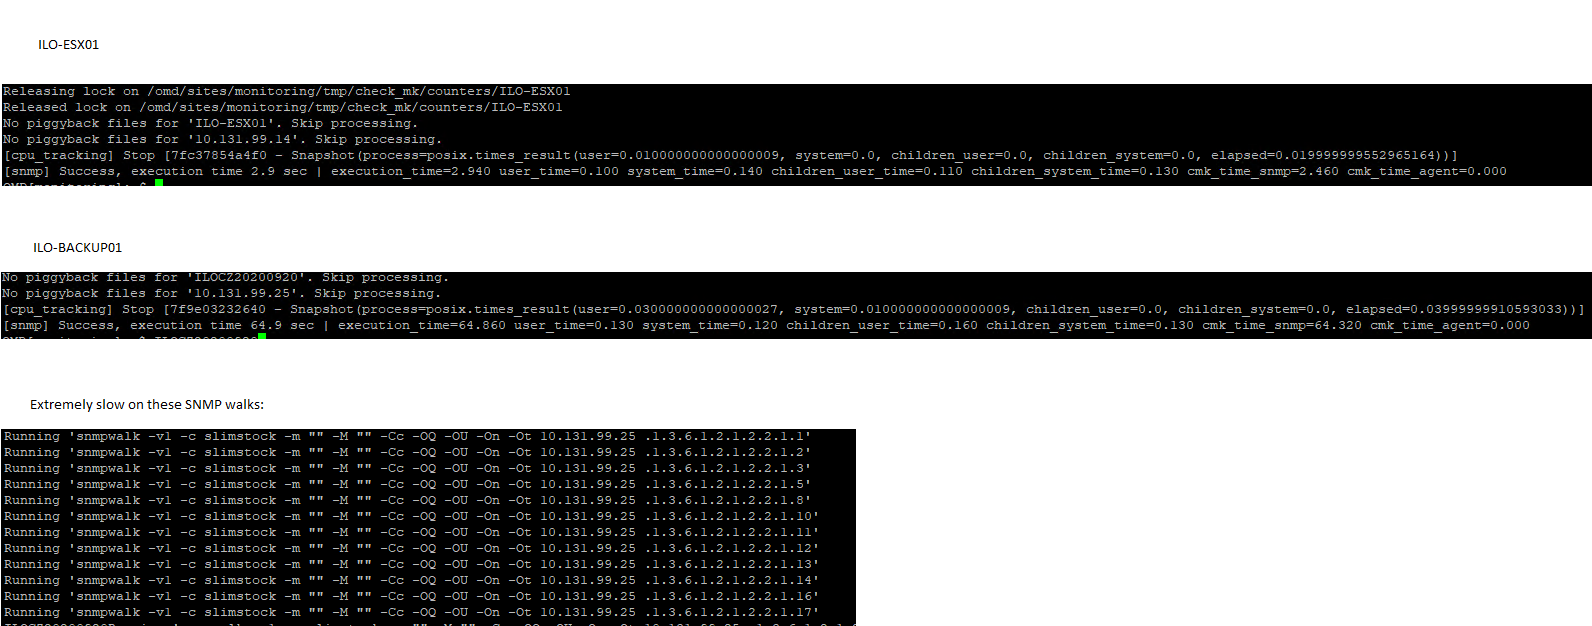
@paulr282 It is definately some kind of issue with the response time of the SNMP.
In the picture i have an output from a correctly working ILO SNMP readout at only 2.9 seconds compared to 64.9 seconds on the “broken” server.
I’ve noticed that specifically a few SNMP walks are extremely slow, as seen in the picture under Extremely slow on these SNMP walks:
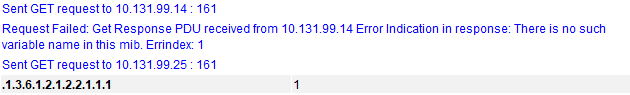
@paulr282 I’ve just used the ManageEngine Mibbrowser to test this.
When i do a snmpwalk to 10.131.99.25 (the problem ILO host) with OID: .1.3.6.1.2.1.2.2.1.1 i get a response “1”
When i do a snmpwalk to 10.131.99.14 or other working ILO host i get response: Request Failed: Get Response PDU received from 10.131.99.14 Error Indication in response: There is no such variable name in this mib. Errindex: 1
Yes, when i compare the 2 ouputs from cmk --debug -vv it both snmpwalks the “problematic” OID’s.
But the ones on a working host go by instantly whereas the host that isn’t working correctly takes about 5-10 seconds per OID.
.1.3.6.1.2.1.2.2.1.1
.1.3.6.1.2.1.2.2.1.2
etc. etc.
So I guess it´s not the ILO itself either. Maybe something in your network? Maybe a problem with checkmk?
Sorry, I don’t really know how to troubleshoot this further.
Hi @paulr282 Thank you for all the help nonetheless, these steps will definitely help me in the future for any other troubleshooting.
I will try some more things with networking to see if i can get it working, thanks!