Hi
I followed this old guide to create a plugin/agent for monitoring Fortigate Virtual Domains (VDOMs):
def inventory_fortigate_vdom_cpu(info):
    for VDOMname, cpuusage in info:
        yield VDOMname, cpuusage

fortigate_vdom_cpu_default_levels = (80.0, 90.0)

def check_fortigate_vdom_cpu(item, params, info):
#    warn, crit = params
    warn = fortigate_vdom_cpu_default_levels[0]
    crit = fortigate_vdom_cpu_default_levels[1]
    for VDOMname, cpuusage in info:
        if  VDOMname == item:
            cpuusage = float(cpuusage)
            perfdata = [ ( "CPUusage", cpuusage, warn, crit ) ]
            if  cpuusage > crit:
                return 2, "CRIT - excessive CPU usage (%s>%s): %s" % (cpuusage,crit,cpuusage), perfdata
            elif cpuusage > warn:
                return 1, "WARN - CPU usage is worrying (%s>%s): %s" % (cpuusage,warn,cpuusage), perfdata
            else:
                return 0, "OK - CPU usage is normal: %s" % (cpuusage,), perfdata

check_info["fortigate_vdom.cpu"] = {
    "check_function"        : check_fortigate_vdom_cpu,
    "inventory_function"    : inventory_fortigate_vdom_cpu,
    "service_description"   : "VDOM %s CPU usage",
    "has_perfdata"          : True,
    "snmp_info"             : ( ".1.3.6.1.4.1.12356.101.3.2.1.1", [ "2", "5" ] ),
    "snmp_scan_function"    : lambda oid: oid(".1.3.6.1.4.1.12356.101.3.2.1.1.5.*") != None,
}
.1.3.6.1.4.1.12356.101.3.2.1.1.2.* is a table holding the VDOM names.
.1.3.6.1.4.1.12356.101.3.2.1.1.5.* is a table holding the VDOM CPU usage.
It appeared to run fine… so I created another plugin for Memory Usage:
check_info["fortigate_vdom.memory"] = {
    "check_function"        : check_fortigate_vdom_mem,
    "inventory_function"    : inventory_fortigate_vdom_mem,
    "service_description"   : "VDOM %s memory usage",
    "has_perfdata"          : True,
    "snmp_info"             : ( ".1.3.6.1.4.1.12356.101.3.2.1.1", [ "2", "6" ] ),
    "snmp_scan_function"    : lambda oid: oid(".1.3.6.1.4.1.12356.101.3.2.1.1.6.*") != None,
}
But eventually I realized that the graphics displayed the same values for CPU and Memory and they were wrong – I run a script which launches check_snmp comands and displayed other values.
Where is my mistake?
Best regards.
P.D: Here you can find a snapshot of the graphics of the three services of the same VDOM called root. They look the same graphic, even though their values are very different:
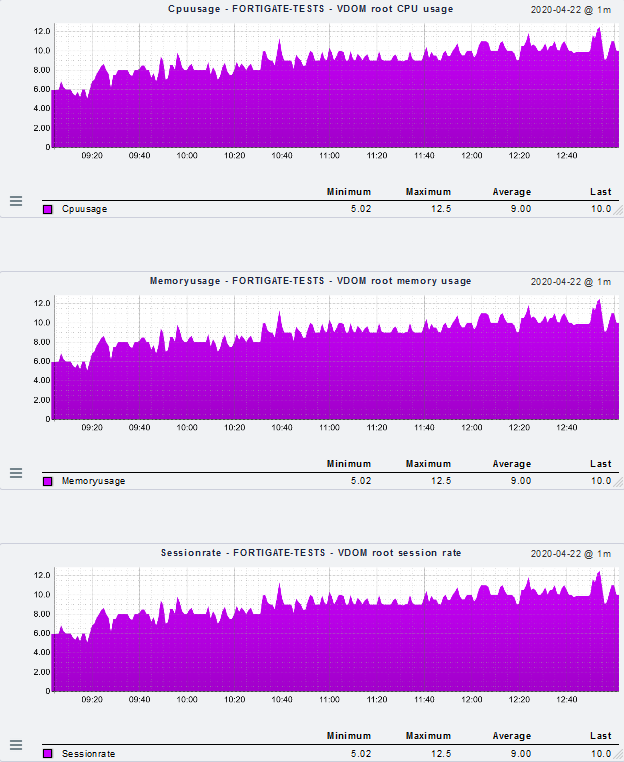
The current values got by check_snmp Nagios plugin are:
SNMP OK - CPUusage 13 | CPUusage=13;80;90
SNMP OK - Memoryusage 13 | Memoryusage=13
SNMP OK - Sessionrate 1963 | Sessionrate=1963