Hi,
I am trying to learn how to write my own check plug-ins. I’m starting with “CIFS shares”, which should basically be “CIFS mounts” but the combination of server and share name shall be unique. Yes, some moron made a dozen mounts to the same server/share. That will be cleaned up later.
I have /usr/lib/check_mk_agent/plugins/ALH_cifsshares which gives me:
<<<alh_cifsshares>>>
hdmssrv.hn.de/archive ok 456340275200 123522686976
hdmssrv.hn.de/sue ok 30064771072 20539867136
On the server I have ~/local/lib/check_mk/base/plugins/agent_based/alh_cifsshares.py:
#!/usr/bin/env python3

from .agent_based_api.v1 import *
import pprint

def discover_cifsshares(section):
    for share, state, total, free in section:
        yield Service(item=share)

def check_cifsshares(item, section):
    for share, state, total, free in section:
        if share == item:
            total = int(total)
            free = int(free)

            used = total - free
            if total != 0:
                pctused = 100.0 * used / total
            else:
                pctused = 0
            if state == "ok":
                s = State.OK
            else:
                s = State.CRIT

            yield Metric("cifstotal", total)
            yield Metric("cifsused",
                    used,
                    levels=(0.85 * total, 0.95 * total)
            )
            yield Metric("cifsfree", free)
            yield Metric("cifspctused", pctused)

            yield Result(
                state = s,
                summary = "%s used (%s of %s), state=%s" % (
                    render.percent(pctused),
                    render.disksize(used),
                    render.disksize(total),
                    state,
                )
            )
            return

register.check_plugin(
    name="alh_cifsshares",
    service_name="CIFS share %s",
    discovery_function=discover_cifsshares,
    check_function=check_cifsshares,
)
Then I have ~/local/share/check_mk/web/plugins/metrics/alh_cifsshares.py:
#!/usr/bin/env python3

from cmk.gui.i18n import _
from cmk.gui.plugins.metrics.utils import *

metric_info["cifstotal"] = {
    "title": _("Filesystem size"),
    "unit": "bytes",
    "color": "13/a",
    # red
}

metric_info["cifsfree"] = {
    "title": _("Free spice"),
    "unit": "bytes",
    "color": "23/a",
    # yellow
}

metric_info["cifsused"] = {
    "title": _("Used filesystem space"),
    "unit": "bytes",
    "color": "33/a",
    # green
}

metric_info["cifspctused"] = {
    "title": _("Used filesystem space %"),
    "unit": "%",
    "color": "43/a",
    # blue
}

graph_info["cifscombined"] = {
    "title": _("Filesystem size and used spice"),
    "metrics": [
        ("cifsused", "area"),
        ("cifsfree", "stack"),
        ("cifstotal", "line"),
    ],
    "conflicting_metrics": ["cifspctused"],
}
Last not least I have ~/local/share/check_mk/web/plugins/perfometer/alh_cifsshares.py:
#!/usr/bin/env python3

from cmk.gui.i18n import _
from cmk.gui.plugins.metrics.utils import *

perfometer_info.append({
    "type": "linear",
    "segments": ["cifspctused"],
    "total": 100.0,
})
This gives me:
Why is the perfometer purple? I would expect it to be blue (
"color": "43/a").
Also it gives me:
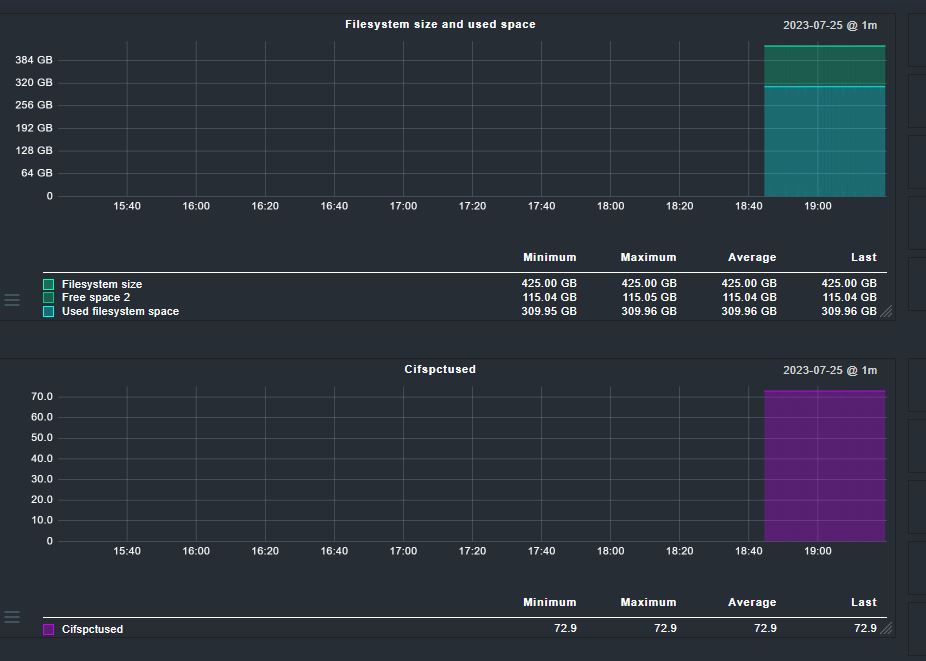
Why is it not “Free spice” but “Free space 2” (something I tested earlier)?
Why is it not “Filesystem size and used spice” and not "“Filesystem size and used space” (something I tested earlier)?
Why does the first graph uses different shades of green instead of red, yellow and green?
Why ist there a second graph “Cifspctused” although I configured "conflicting_metrics": ["cifspctused"] at the first graph?
Kind regards,
Robert