HI
Initially I monitored the machine through the agent.
But then I noticed that splunk went down but I didn’t immediately notice the problem.
I tried to configure the special agent
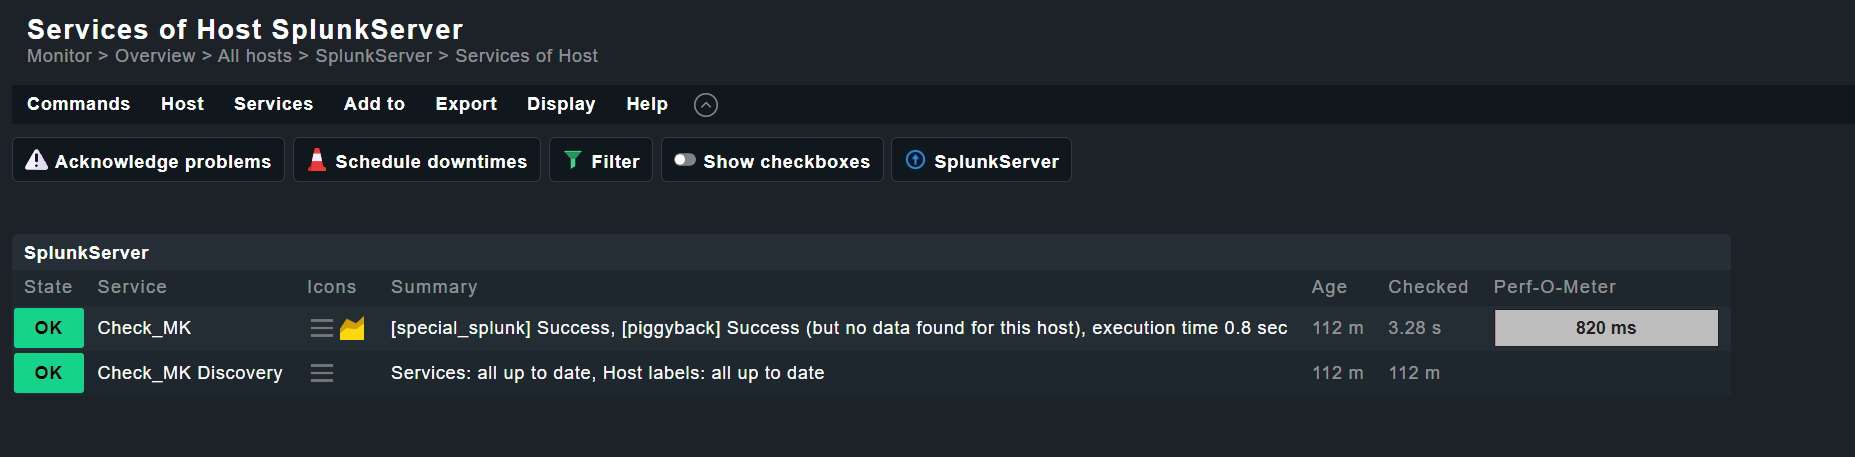
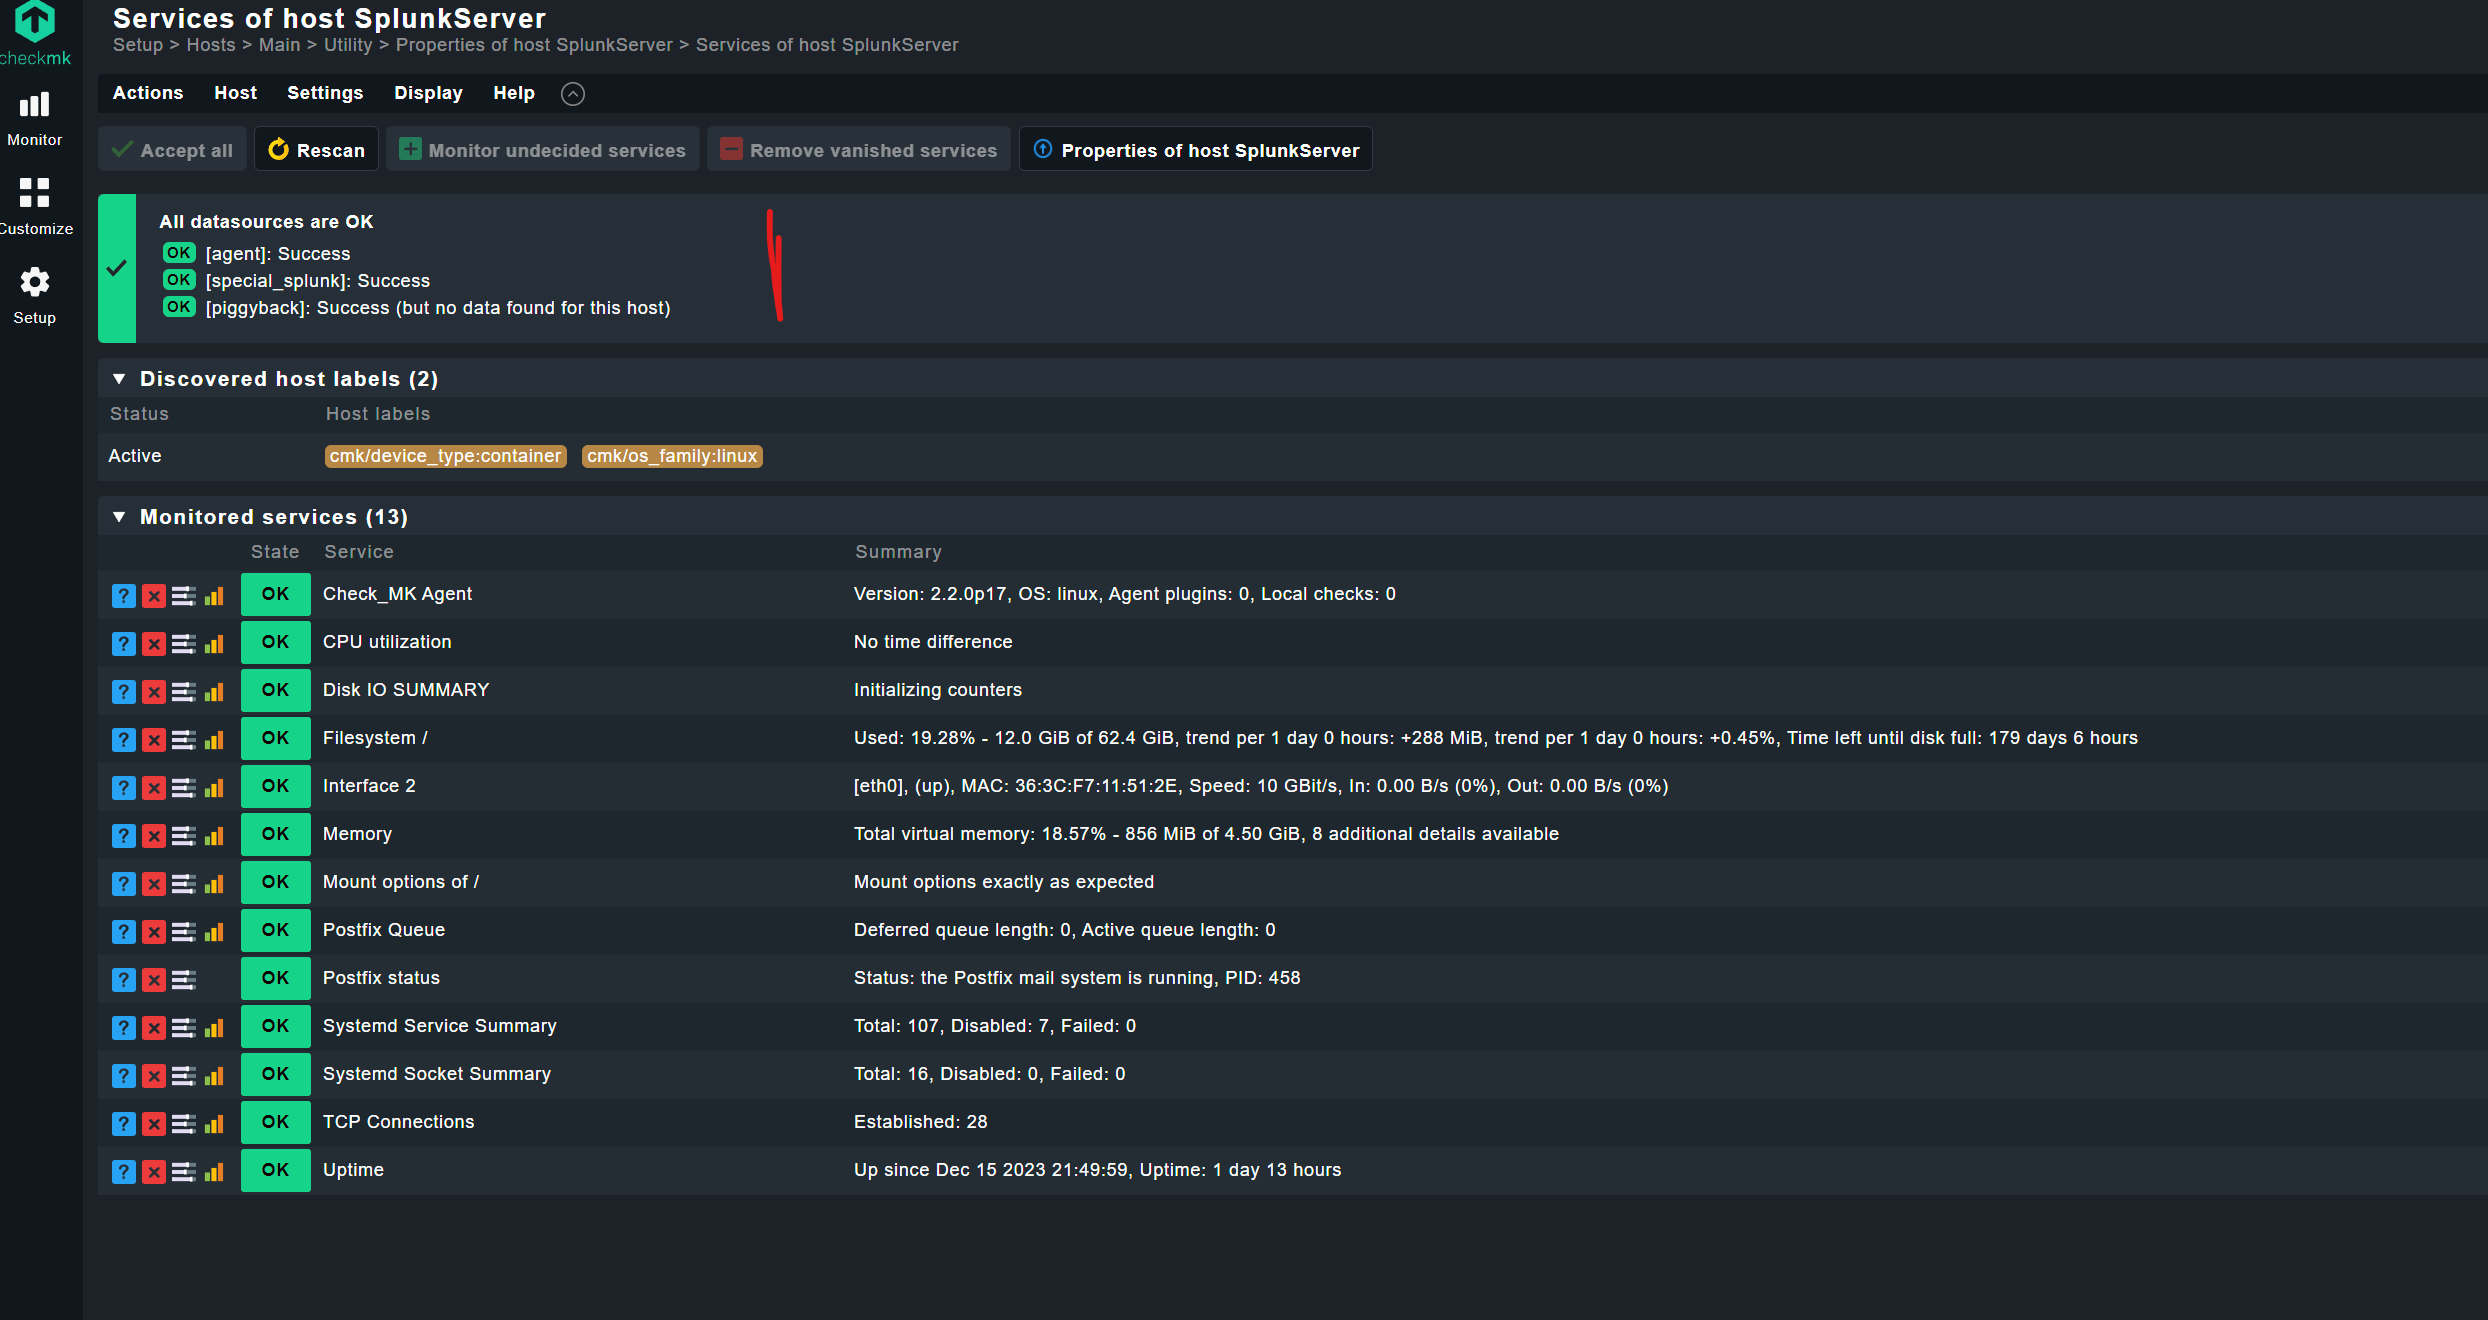
I currently see this:
I don’t see any metrics anymore
I imagine that if the service goes down I get an alert but I see practically nothing about the server
I believe the documentation for these functions is unclear.
Can you help me?
I’m sorry for my english
no need to apologize for your English, we have users from all over the world here. So everyone is well aware that English isn’t everyone’s first language.
HI
I followed the document
I just added the variant of monitoring agents and APIs
It looks like api is working but I don’t see any metrics for API.
I suspect that the problem is SSL not being active on splunk
I’ll try to activate a certificate on splunk and then do another test
This topic was automatically closed 365 days after the last reply. New replies are no longer allowed. Contact an admin if you think this should be re-opened.