I’m trying to monitor ink in a printer. I’ve written an agent script, and a plugin, and it all works - I can do a service discovery and it finds 4 “services” - one for each color.
I get a graph of the remaining ink of each color, but it’d be waaaay more useful to have all four on one graph, but I can’t see how to do this.
Internally it’s basically right out of the docs:
 def check_com_falkensweb_hp_officejet(item, section):
    for ink, remain in section:
        if ink == item:

            remain = int(remain)

            yield Metric(
                "remaining",
                remain,
                levels=(20,5),
                boundaries=(0,100))
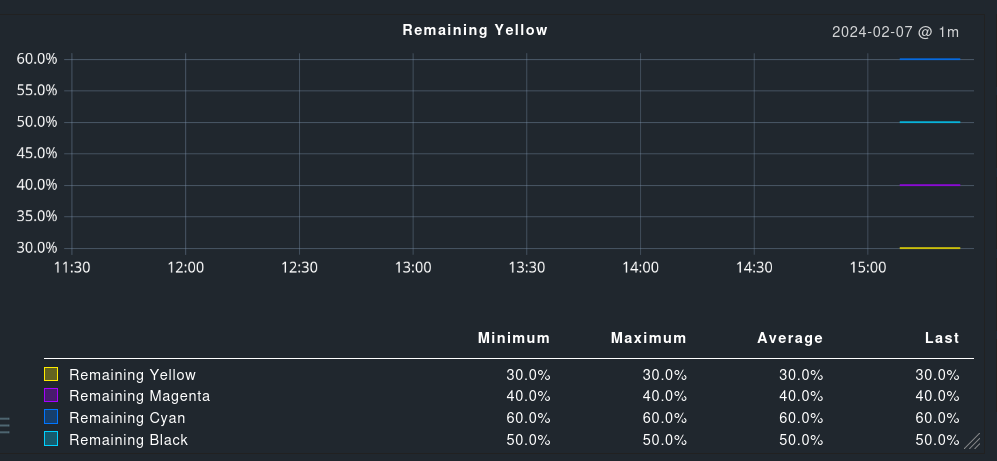
OK	HP Officejet Black	[Open the action menu]
	Black 50% remaining	22 h	12.1 s
OK	HP Officejet Cyan	[Open the action menu]
	Cyan 60% remaining	22 h	12.1 s
OK	HP Officejet Magenta	[Open the action menu]
	Magenta 40% remaining	22 h	12.1 s
OK	HP Officejet Yellow	[Open the action menu]
	Yellow 30% remaining	22 h	12.1 s
But I can’t find my graph anywhere, or even a message saying it’s not drawn for some reason.
Is there a way to debug this? Or have a made a stupid typo somewhere ?!?
You can select the colors of the lines to match the ink from the following palette:
 Colors:

                   red
  magenta                       orange
            11 12 13 14 15 16
         46                   21
         45                   22
   blue  44                   23  yellow
         43                   24
         42                   25
         41                   26
            36 35 34 33 32 31
     cyan                       yellow-green
                  green

Special colors:
51  gray
52  brown 1
53  brown 2

For a new metric_info you have to choose a color. No more hex-codes are needed!
Instead you can choose a number of the above color ring and a letter 'a' or 'b
where 'a' represents the basic color and 'b' is a nuance/shading of the basic color.
Both number and letter must be declared!

Example:
"color" : "23/a" (basic color yellow)
"color" : "23/b" (nuance of color yellow)

As an alternative you can call indexed_color with a color index and the maximum
number of colors you will need to generate a color. This function tries to return
high contrast colors for "close" indices, so the colors of idx 1 and idx 2 may
have stronger contrast than the colors at idx 3 and idx 10.
retrieve an indexed color.
param idx: the color index
param total: the total number of colors needed in one graph.
With your check you cannot gain a combined graph as you have 4 different checks (items).
A combined graph inside a check is only possible if all metrics are from the same check.
That means you need only one check like (HP ink levels) with 4 metrics.
That’s got the graph appearing, but is there a delay after ..._metric.py is changed before Service (host name), HP Officejet updates ?
I’ve tried to title the combined graph - the docs themselves say there are not docs, but it seems like a 'title': _('HP Officejet'), in graph_info is the way to do it.
I’ve even changed one of the metrics to _("Remainingx Yellow"), but this hasn’t changed anything…
I’m running this on Fedora, so not sure which Apache was meant, the main one that listens on port 80/443, or the one that listens on a local port only, or maybe something in checkmk itself.
Anyway, I came back to do this today and it’s started to work by itself, along with the perf-o-meter.
That’s correct if you wait some time between some minutes and hours the Apache should use your files. This is a caching problem.
The only Apache you need to restart is the one that runs inside your OMD site.