AH HA; Thanks so much.
That’s got the graph appearing, but is there a delay after ..._metric.py is changed before Service (host name), HP Officejet updates ?
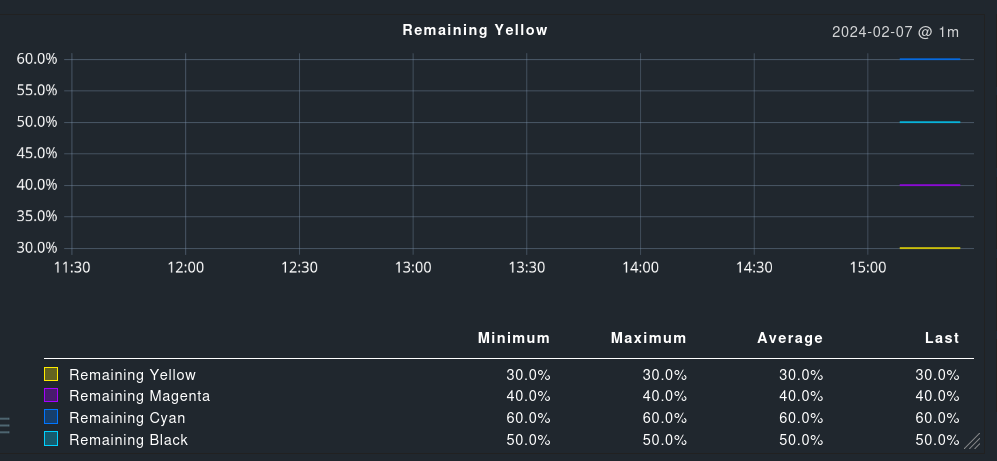
I’ve tried to title the combined graph - the docs themselves say there are not docs, but it seems like a 'title': _('HP Officejet'), in graph_info is the way to do it.
I’ve even changed one of the metrics to _("Remainingx Yellow"), but this hasn’t changed anything…