CMK version: 2.4.0p10 (Raw) OS version: Ubuntu 22.04
Hello,
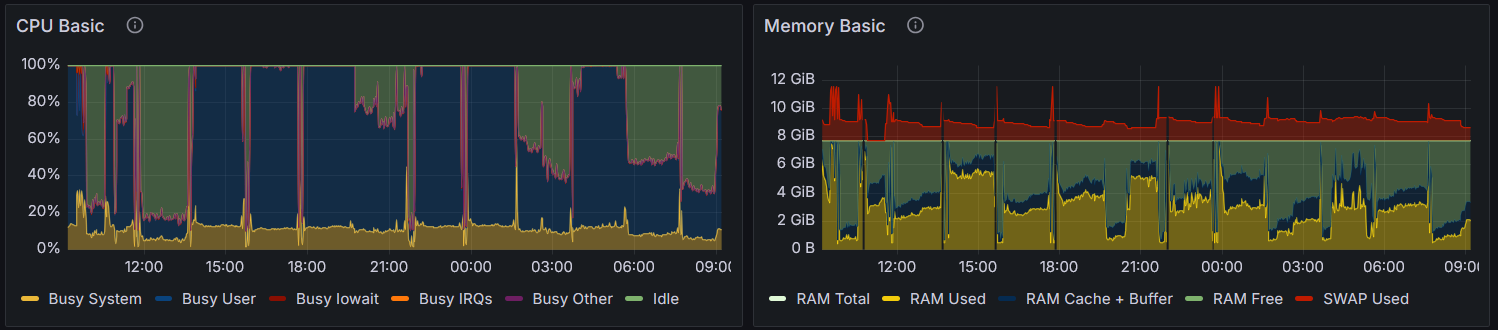
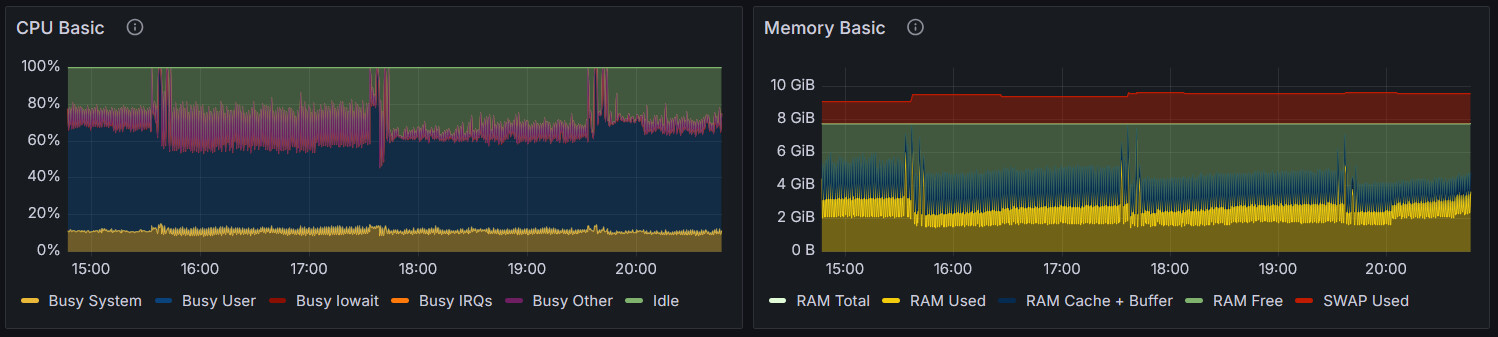
since a few days my CMK installation has gone completely wild. Checks time out frequently, hundrets of Discovery timeout errors are shown and the CPU utitization goes crazy and the Sysload is permanently extremely high.
There was no change at all to the infrastructure or to the monitoring server itself.
The CMK server has 10 CPU cores, 8 GB RAM, 4 GB Swap and the CPU graph shows a lot of userspace utilization and basically no I/O wait.
I use older version, lot smaller environment, but had similar issues. I couldn’t find out what it was until I bumped on following post where limiting concurrent checks made most of my monitoring issues vanish.
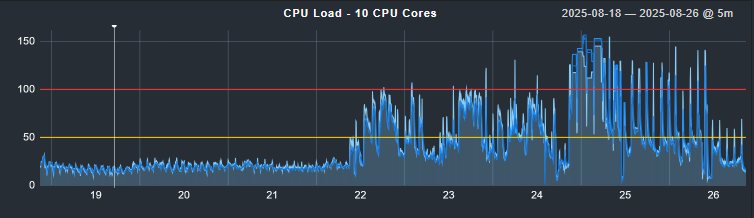
But as clearly visible in the 8 day view, this suddenly started without anything having changed on the monitoring server. There was also nothing added to monitor.