CMK version: Raw 2.3.0p25-1 (Server and agent)
OS version: Debian 12
EDIT: I have reworked this post to be more understandable.
I dont have a problem with phpsessionclean.service especially.
In my case, Systemd Service Summary is reporting too long times for activating or reloading a systemd service because the agent sends in the same output:
- first the timestamp of the last state change and
- a moment later the new state "activating.
My gues ist: the timestamp comes from the output of the second command in the agent section <<<section_systemd >>>
systemctl list-unit-files --full --no-legend --no-pager --plain --type service --type socket | tr -s ' '
and the state (change) comes from the output of the third command in the agent section <<<section_systemd >>>
systemctl --all --type service --type socket --full --no-legend --no-pager --plain | sed '/^$/q' | tr -s ' '
My question: Is the agent sporadically sending non consistent output for the systemd services which leads to this notification?
Examples:
Local time: 20:29
Active: inactive (dead) since Wed 2025-02-19 20:09:00 CET; 29min ago)

phpsessionclean.service loaded activating start start Clean php session files
leads to: phpsesssionclean activating for: 29 minutes 0 seconds
and just arrived (until now I got only the notification):
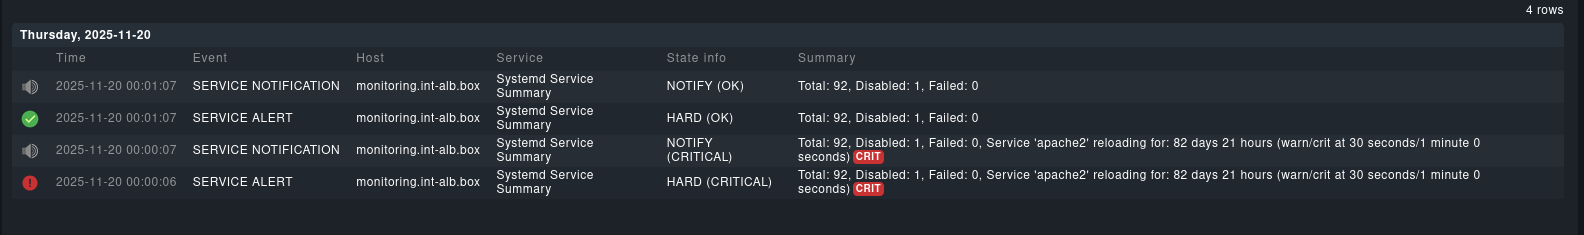
Service apache2 reloading for: 11 days 0 hours
This apache2.service isn’t reloading for 11 days ![]()
To find the cause I have a tcpdump for localhost port 6556 and agent in legacy mode.
At the time of the last notification I found this in the tcpdump capture on agent output (strong markup from me):
… phpsessionclean.service - Clean php session files
Loaded: loaded (/lib/systemd/system/phpsessionclean.service; static)
Active: inactive (dead) since Wed 2025-02-19 20:09:00 CET; 29min ago
TriggeredBy: … phpsessionclean.timer
Process: 3761458 ExecStart=/usr/lib/php/sessionclean (code=exited, status=0/SUCCESS)
Main PID: 3761458 (code=exited, status=0/SUCCESS) CPU: 201ms
and in the same agent output:
phpsessionclean.service loaded activating start start Clean php session files
I appreciate your help and say Thank you in advance.