I’m wondering if it would be possible to create a table view - similar to the matrix view for performance data (Ansichten von Hosts und Services (Views)) - for more than just one value per service.
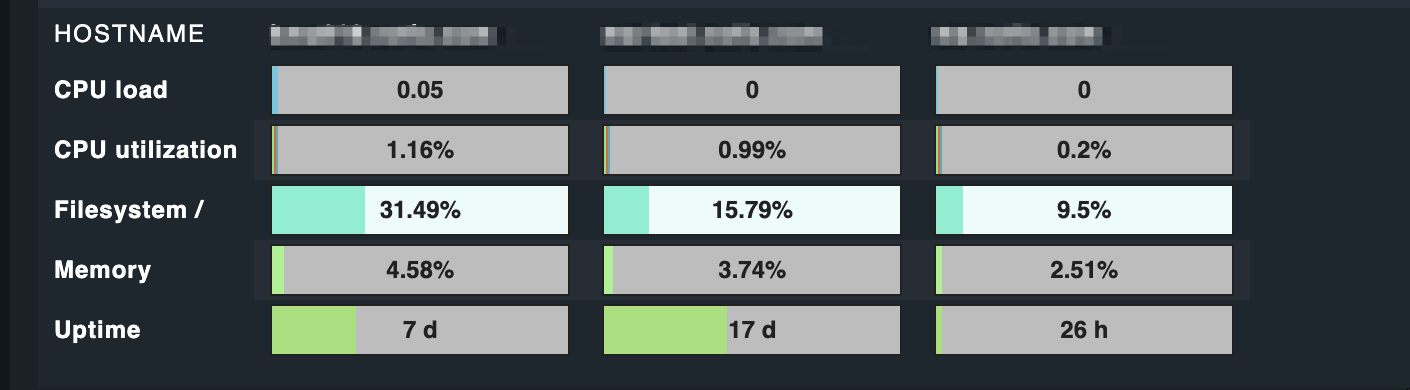
I think about having a plugin, delivering several integer values as array or so and having them displayed the same way I can now display the CPU load per host in a table.
OK, let me try to ask on another way: I’m observing a WebRTC conferencing system.
The system is designed to organize the communication in “rooms”. Participants in a room can play different roles: zero or one “controller”, zero or one “publisher” and zero to unlimited “subscribers”.
I’m sure I will be able to obtain the info from my hosts, which would then probably have this JSON representation:
Of course there would always be the way of a textual representation of this info, but I would like to represent that in kind of a table view, grouped by rooms
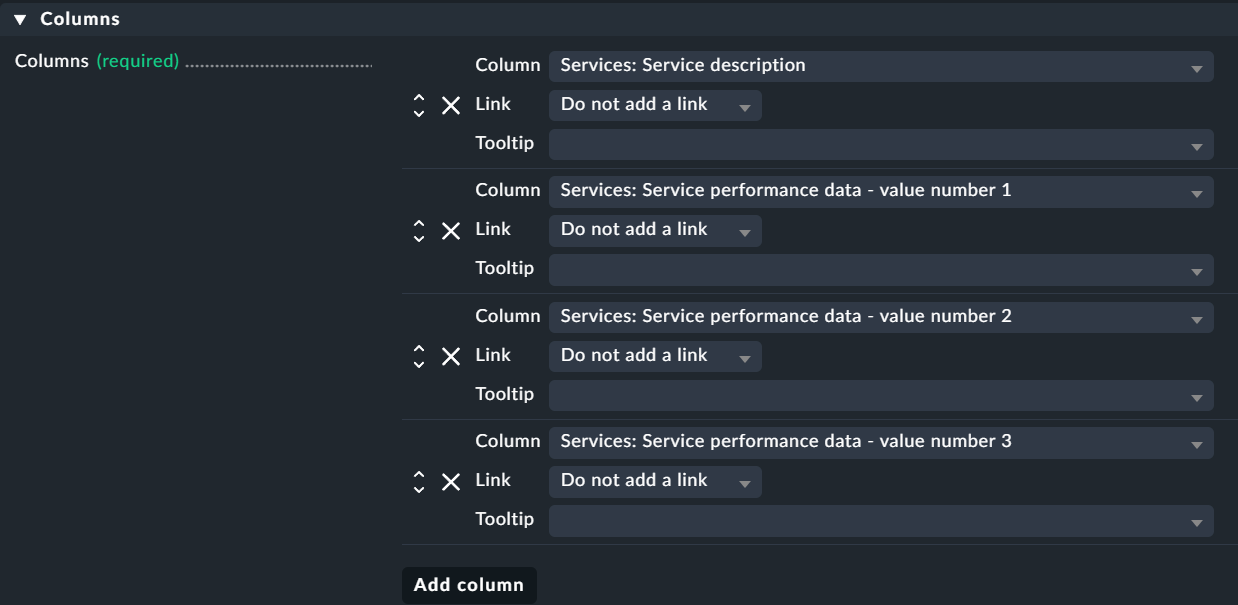
For your data create a check that has the room name as item and the three values as performance data output.
The view itself is then build from the service description and the performance values 1 to 3.
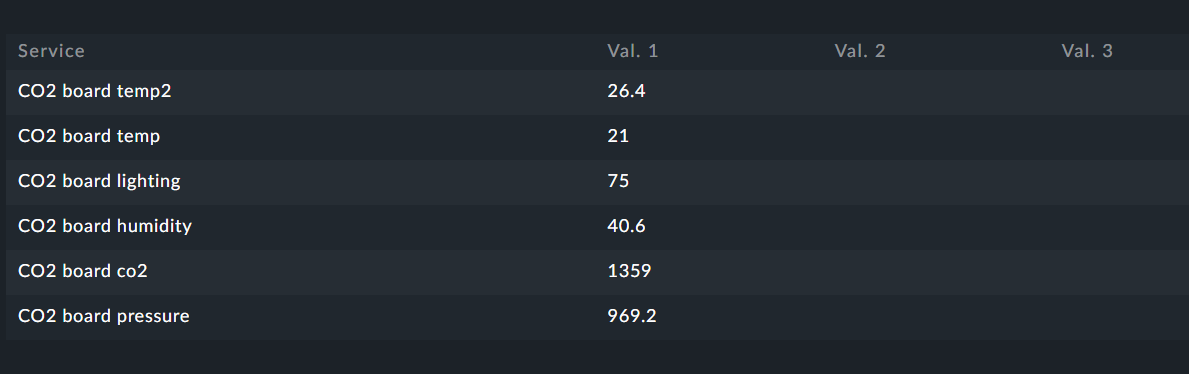
Like this example
I had only services with one performance value here.
An alternate approach would be the room name as hostname and for every type of performance value one service. Then also the problem with the table header would be gone.
Ouch, I also had both ways on the radar, but had the hope there would be a smarter way.
Other than that the number of “rooms” object in such an array is dynamic and unknown beforehand, so I doubt there would be a way to use the matrix, since the “hosts” would have to be defined in the beginning, wouldn’t they?
Anyway, if there is no nice way to do this (which baffles me a bit, since I don’t think my requirement is that exotic) I will be going the “text” way. A summary as like 20 rooms with 10 controllers, 8 publishers and 200 subscribers or A total of 218 users currently active in 20 rooms in order to get an estimate of the load to be expected. I think this could even be more informative than the detailed view, which can be flapping as well (and annoying by that).
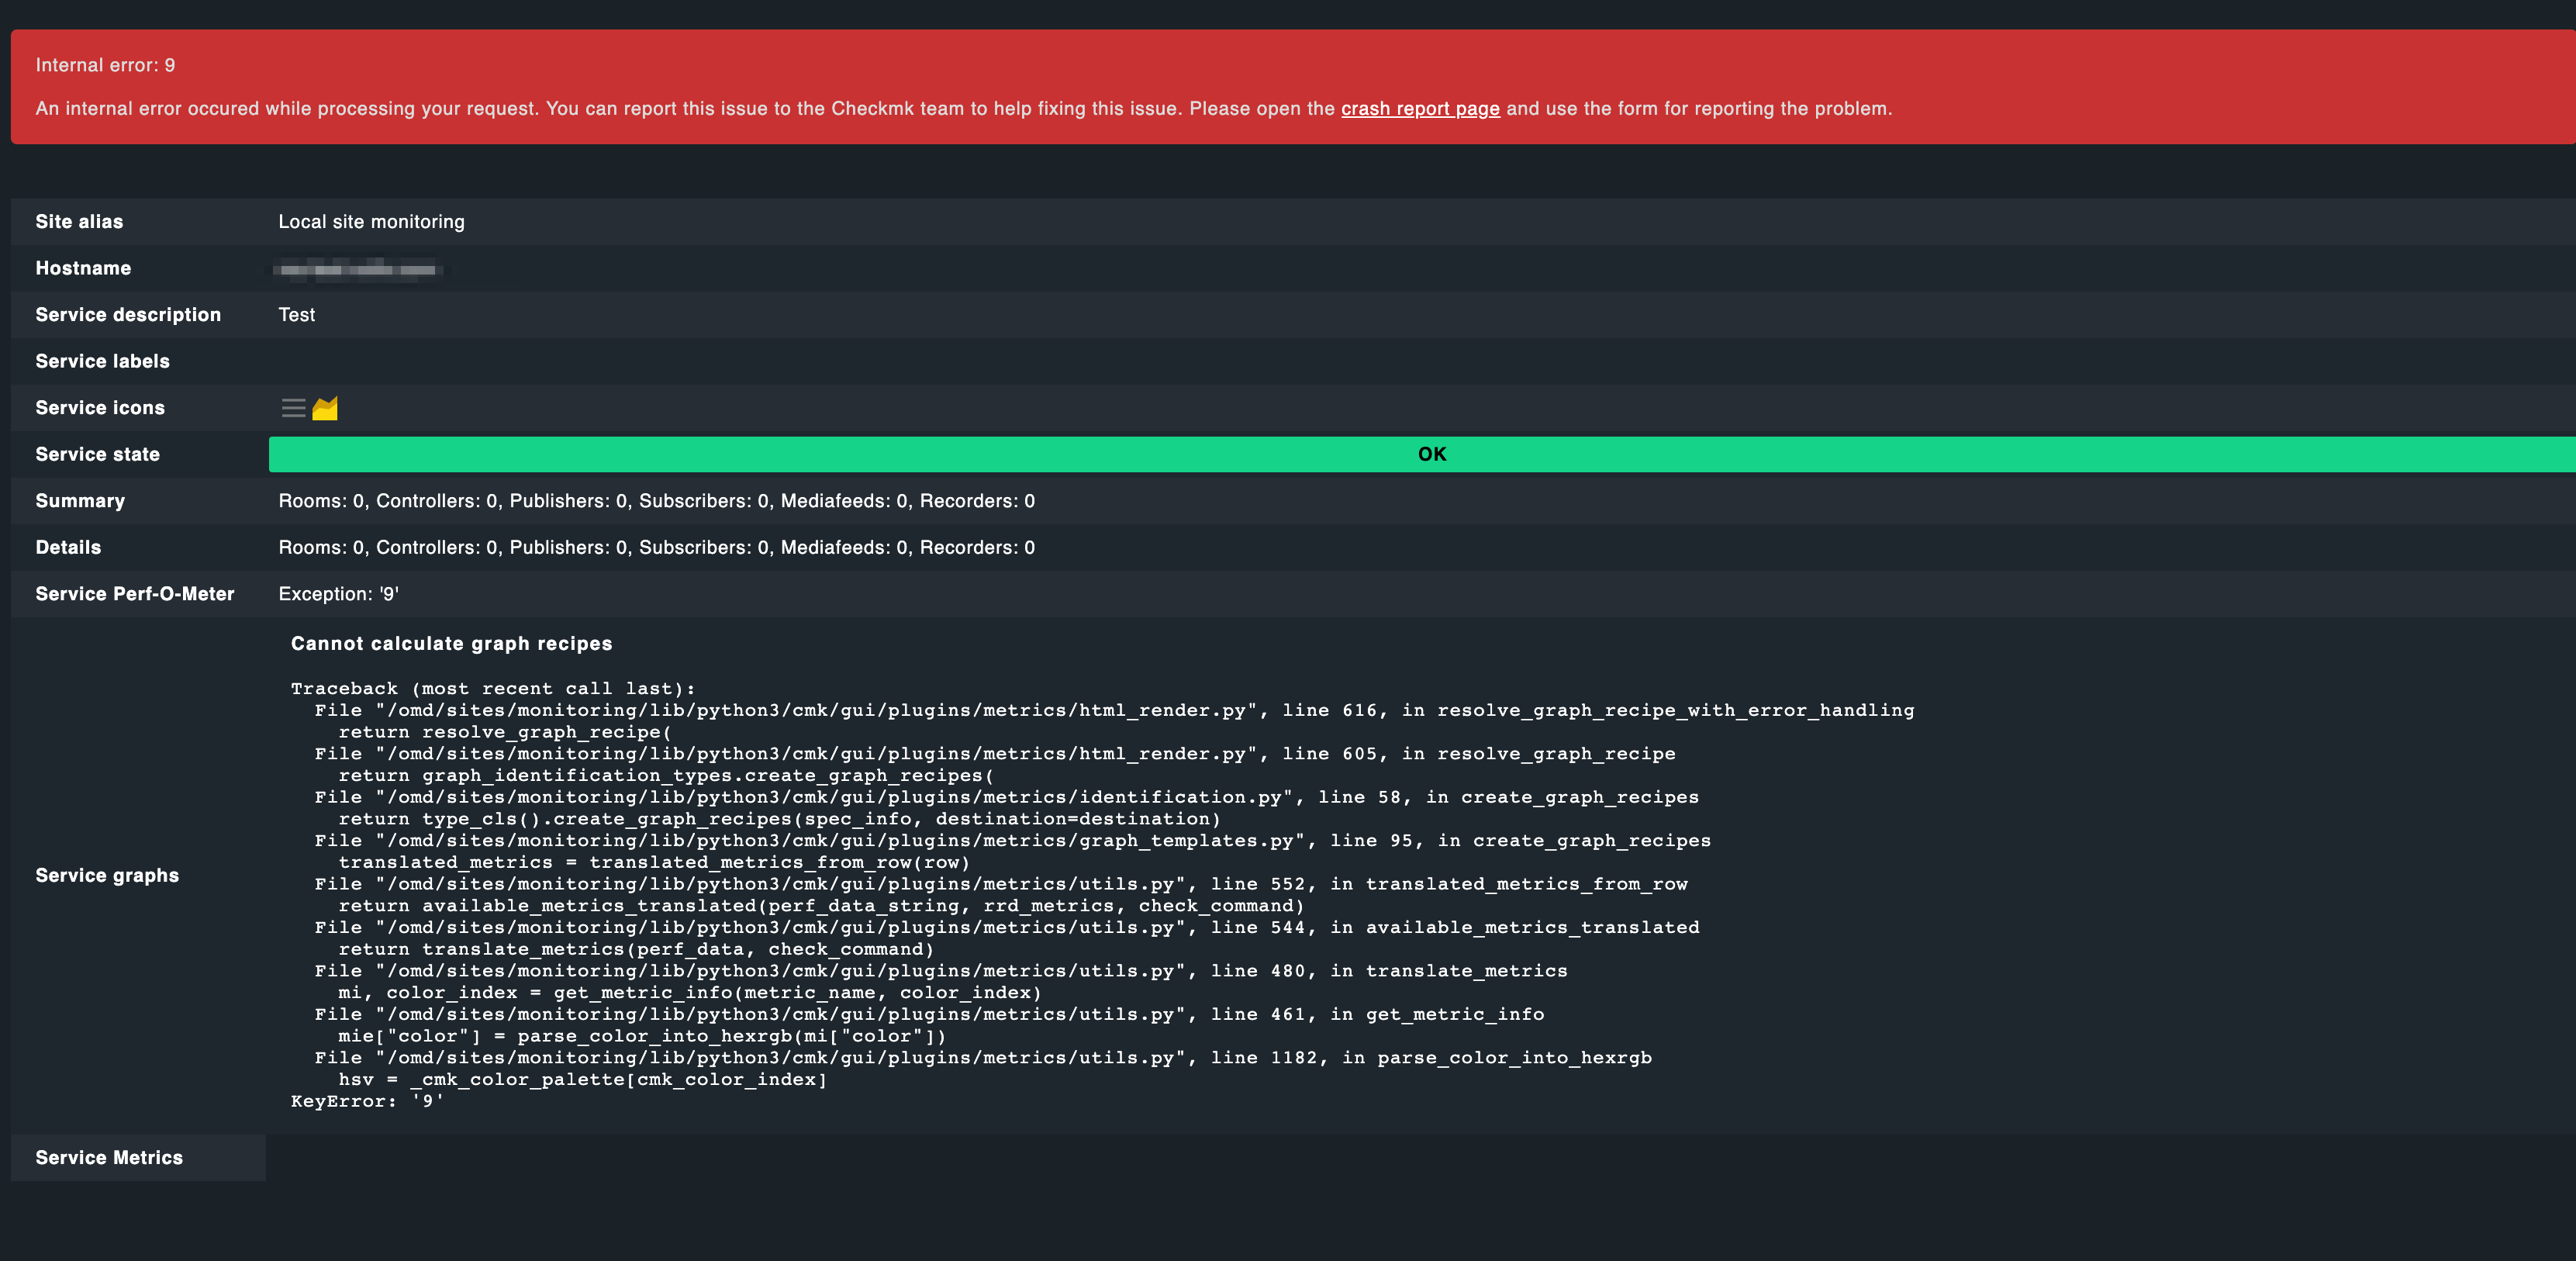
OK, I’m now having my metrics in the view. But some strange things happen: While monitoring the status in the browser I’m seeing graphs with “old” colours (I played a bit with the colours).
For instance I set all my colours to some blue. The first update int the browser shows the blue colour. Then with the next update old colour settings appear. Even a crash dump (maybe I made a mistake somewhen, but this was in the past).
Does the GUI display some cached content from Apache? How to solve that? At least it is not a real-time view, since also the time line is outdated.
In addition to this, maybe somebody is able to explain me that behaviour. I specifically mean, why I’m getting presented outdated graphs (which have been produced with previous versions of my plugin).
Video here:
Here is the code for all (not mine, found it all here in the forum or in documentation and stitched it together). My primary aim is to display several metrics in one graph. I’m showing here the last versions of the code, but the images rendered in the video make sense to me, since they are based on outdated, former versions.
Host (/usr/lib/check_mk_agent/local/local)
#!/bin/bash
echo '0 "My 2nd service" count1=42|count2=23 A service with 2 graphs'
As you can see in the video, at least twice the latest version of the graph appears (the one with the thin red and green line). But what do I need to do in order to get rid of all the old stuff?
For CRE there is a way to delete the rrd files from the folder. This at least solves the biggest issues.
But still: There is a mix of separate views of each metric and combined views (all in once). And color definitions are not recognized in the combined view. Ordering is also nuts…
And why an integer counter needs to have an average will remain the secret of CMK…
This topic was automatically closed 365 days after the last reply. New replies are no longer allowed. Contact an admin if you think this should be re-opened.