Error message:
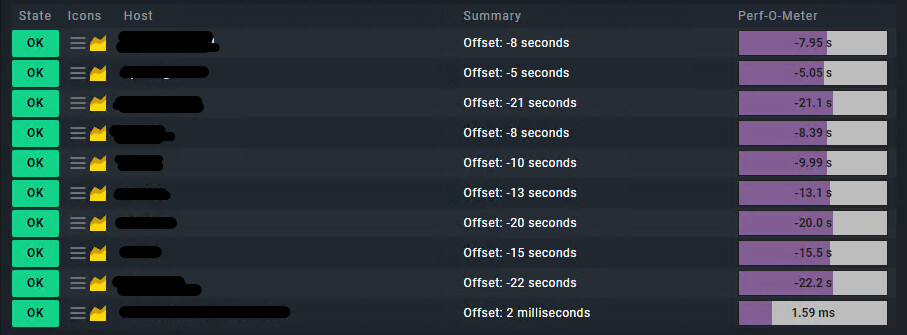
We are seeing issues with the “System Time” service for Windows based hosts monitored by agent. These hosts report a negative offset of anything from -5 to -60 seconds. Average being -31.5s
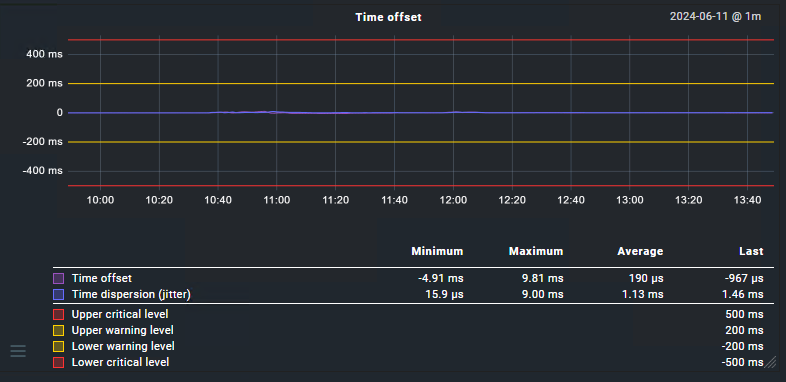
I can’t understand why or what’s causing this. The virt1-appliance is running in a ESXI-cluster that’s sync’d and in time, the “NTP Time” service for the virt1 appliance itself is reporting an average offset of 284 µs - with 1.7ms jitter
While this jitter is not super-duper, it still doesn’t explain why the hosts running agents have a negative sliding system time offset. Everything is using the same NTP-servers, and polling these directly via w32tm or ntpdate -q report good/accurate times.
Any ideas or pointers as to where i should be looking?
As for the load on the CMK-server, it’s currently sitting at “only” load average: 0.25, 0.28, 0.27
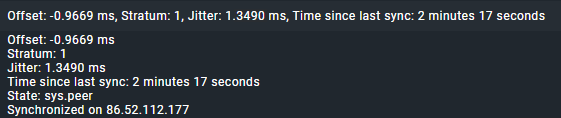
NTP-time from CheckMK-host;
Offset: 0.5142 ms
Stratum: 2
Jitter: 0.5387 ms
Time since last sync: 37 seconds
State: sys.peer
Synchronized on 217.114.59.66
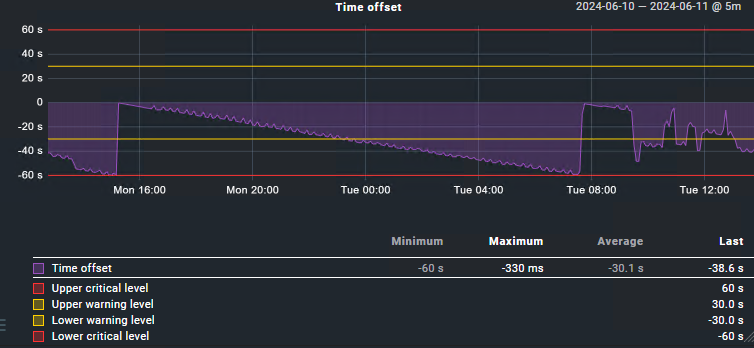
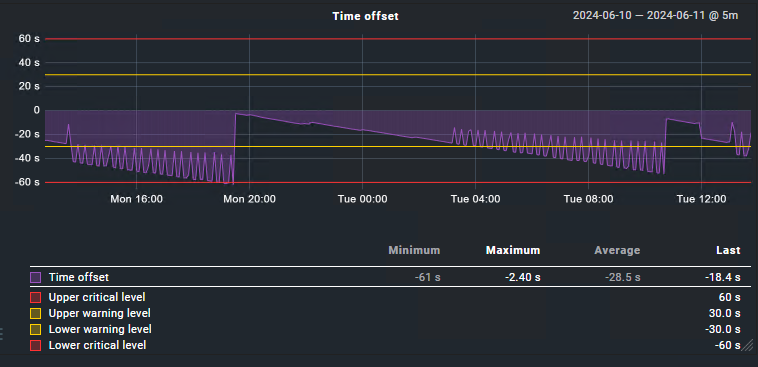
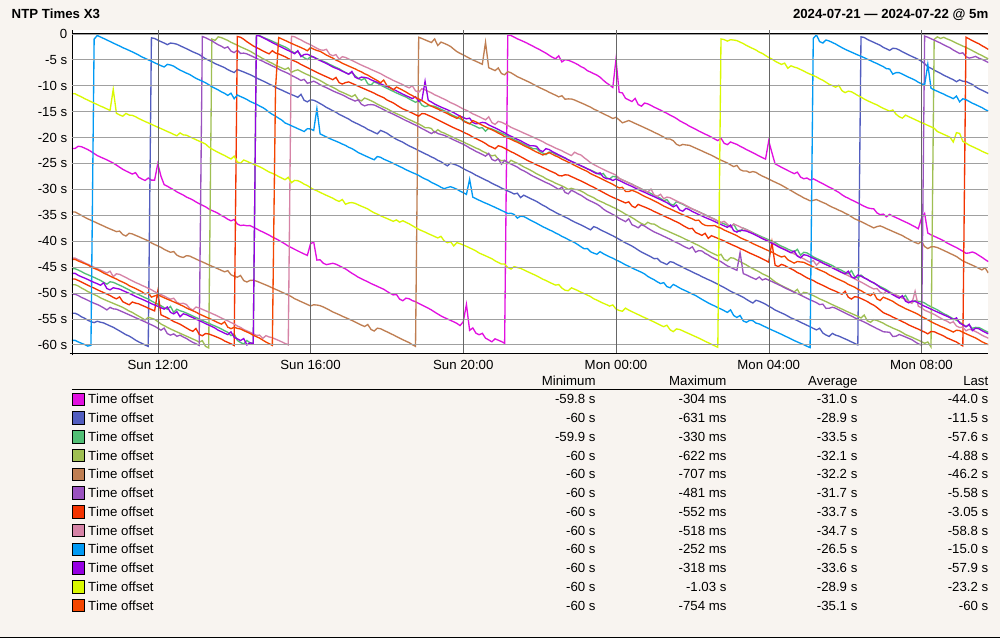
As for an example hosts where the time is shifting over time;
what’s the agent version of one of the affected example hosts? Is that example host using push or pull agent? Does the example host have any plugins and/or local checks? Are the plugins?local checks executed async or sync?
And another thing: how utilized are the fetcher and checker helpers of the site which monitors the example host? Any latencies?
Unfortunately it’s hard to analyze for me without official support case, because of needed data and having a look for myself, so I cannot guarantee anything…
We also experience this problem.
We are currently running Checkmk Cloud Edition 2.3.0p9 with push mode enabled.
The agent pushs the agent data every 60 seconds and until that push, the time offset is visible inside the Checkmk service.
Is there a fix for this?
If you now execute a cmk-agent-ctl push from the corresponding host, the check jumps to OK because the push of the current data is resetting the minus offset.
I hope that makes it a little clearer!
We can see this behavior on all Windows hosts but not necessarily consistently on all.
Right now four of our eight Windows hosts are reporting System Time “WARNs” because of this minus offset. The other four hosts also had the problem a few times within the last 8 hours.
Let me know if i can provide any more information!
I’m experiencing exactly the same behaviour on the following setup:
2.2.0p27 both server and agent
CheckMK Satellite as Azure VM in Subscription X with Chrony using special stratum 0 device /dev/ptp_hyperv
Windows Clients (PUSH-Agent) as Azure VM in Subscription Y with corresponding timesync via Guest Integration (Source: VM IC Time Synchronization Provider)
We also experience a drifting towards a minute in the past. We have tried changing the NTP Servers to common external ones, but it doesn’t make any difference.
All graphs are looking more or less the same: at some point being close to zero but then slowly but steadily being behind.
Also happy to provide more information, if I can…
Regards
Simon
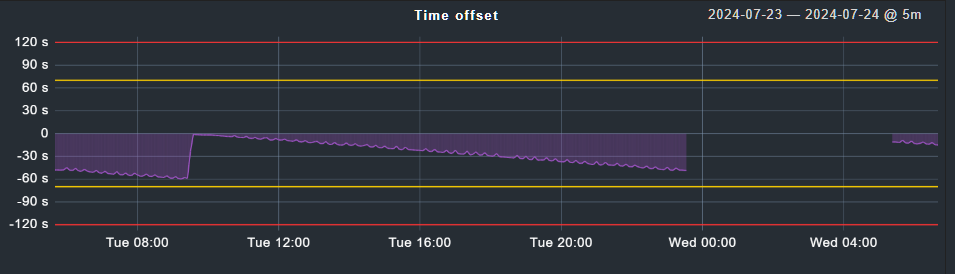
EDIT: I made a graph for you guys. Looks to me as an off-by-one-error
same issue here with “Free Edition” of the appliance. My one Win10 client showing the exact same behaviour. The “real” local times are indentical +/- 1 second for all my devices. It may be worth noted that this behaviour was “consistent” right from the beginning with all versions of the appliance/checkmk/checkmkagent since I started with checkmk in December last year.
Service check command: check_mk-systemtime
[…]
Check manual (for Checkmk based checks): This check is a simple check of the correct setting of the current system time of the target host. It simply compares the local time on the monitoring server with that measured by the agent on the target host. It is not very accurate since it does not account for the systematic time delay between the output of the time by the agent and the actual processing of that data by Checkmk.
Its advantage however, is that it works on any Windows or ESX host - regardless of the method used to synchronize the time.
[…]
Since the “System Time” Check is only used in Windows Agent and the special agent for vSphere for ESX hosts, which is a polling/pull agent only,
it is safe to assume that this bug is limited to the windows agent in push-mode.
Assuming it is only Windows, follow-up question: Are all y’all using your domain controllers as NTP sources? Can you try to switch a few servers to real NTP servers? I am aware, that the time in a domain has to be in sync, I am merely trying to rule out a hypothesis.
Apologies for not replying to my post earlier, mid vacation here.
We are using public NTP-servers, switched from using our own domain controllers. We’ve also tried our own domain controllers in NTP-mode synced to a multitude of different servers all with the same issue. It could be related to windows secure time seeding, or so i thought, but we’ve got hosts ranging fron win2k12 to win2k22 all displaying these issues. Primarily windows hosts, our linux based ones using the same exact servers are reported fine.
I thought it could’ve been relaterade to vsphere too, but that’s not the case neither - cluster members are synced fine and vms aren’t timesync’d via host neither, as thats been disabled.
As per my initial post inside this thread, the behaviour doesn’t change when changing NTP servers to internal ones, public ones, or by leaving them on “take time from hypervisor”, or a combination of all those mentioned.
The only uncertainty here, is that we (I) don’t know if this problem is limited to Azure.
Why the problem exists is very easy to describe.
The Windows agents sends the collected data with push and then the data “lays around” on the monitoring server until it is processed at the next check interval of the Check_MK service. Usually this interval is 1 minute.
Now the problem - System time is not a real check but only a compare between the timestamp of the creation of the agent output at its end and the system time of the monitoring server. What happens now if the file “lays around” on the monitoring server until it is processed? Exactly the time difference is not as small as usual with some milliseconds.
Depending on the load of the monitoring server, the check interval can differ a little bit from exactly one minute. This behavior can explain the appearance of the graphic. The difference is not more than one minute under any circumstances and as the check interval is slightly longer than one minute the difference grows until it reaches nearly 60 seconds.
Conclusion → with Push Agent the Windows system time check is not a good option to check the time of the monitored system.
Well…the check could theoretically stay the way it is.
However, with data coming from the push-agent, there is now a need to flag them as such and then compare the time inside the check (agent’s time) with the timestamp the data arrived at the monitoring satellite instead of now(), which could be - as you just explained - up to 59 seconds later (worst case).