Unable to send SNMP Check-Data to WebGUI

CMK version:
Checkmk Raw Edition 2.3.0p18
OS version:
Rocky Linux 9.6
Kernel: Linux 5.14.0-503.35.1.el9_5.x86_64

Hi everyone

I’m relatively new to Checkmk and trying to monitor my MikroTik switch in more detail. I wrote a small Python script based on this wiki link and some help from ChatGPT.

Unfortunately, neither I nor ChatGPT have been able to resolve the issue I’m running into. My background is more in system engineering than programming.

What I’ve Tried So Far

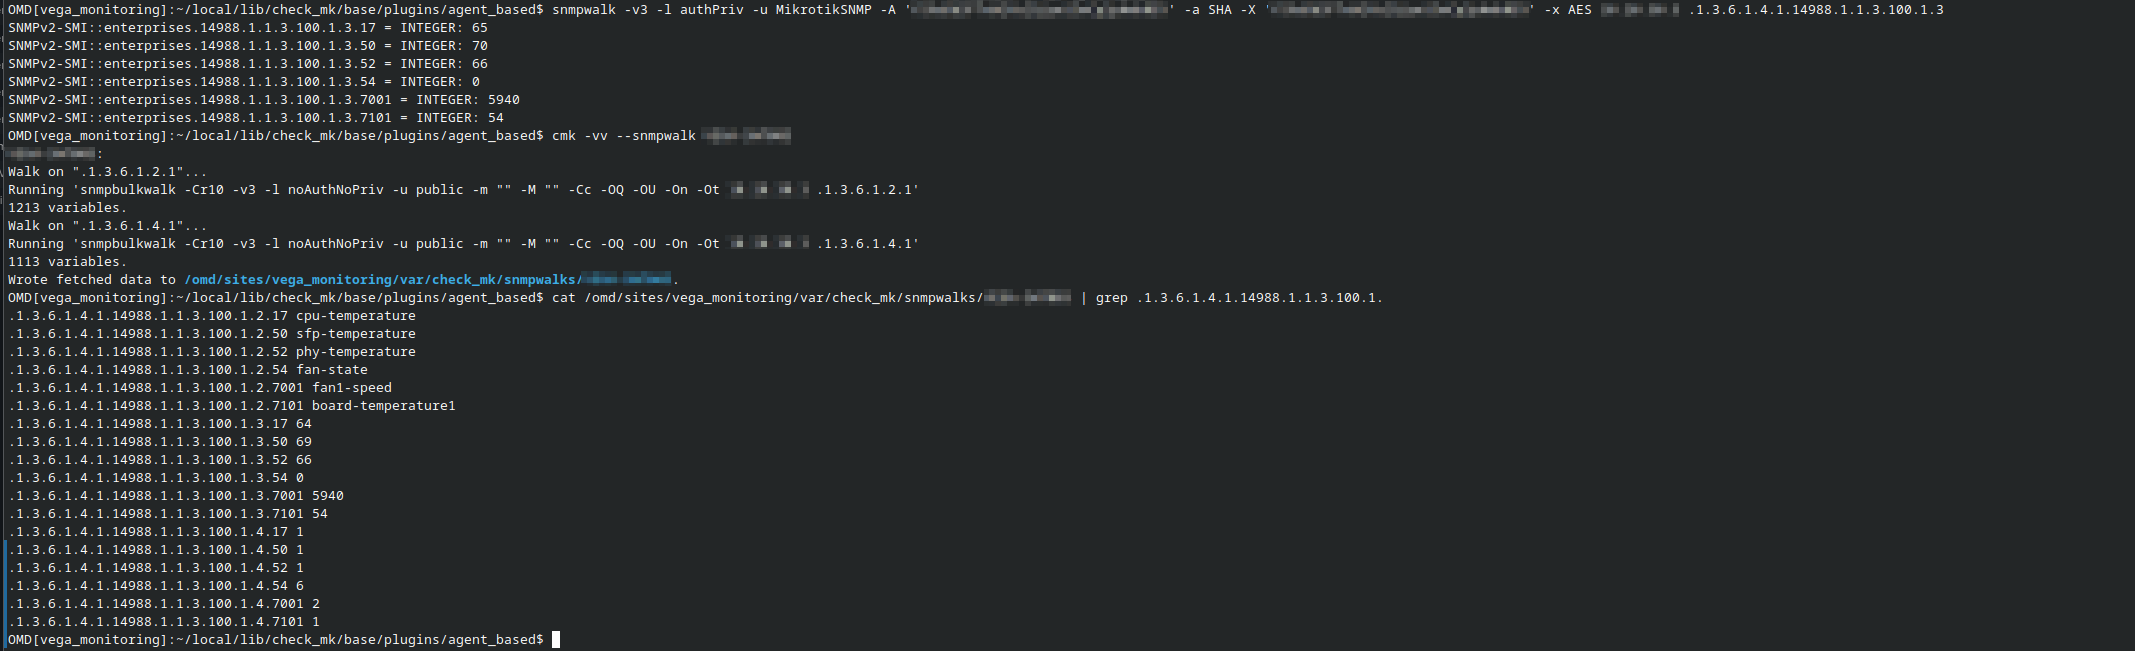
However, I’m stuck at the following stage:

When I run:

cmk --debug -vvv --no-cache --detect-plugins=vega_hwstatus hostname

The following happens:
Error message:

OMD[monitoring_site]:~/local/lib/check_mk/base/plugins/agent_based$ cmk --debug -vvv --no-cache --detect-plugins=vega_hwstatus <HOSTNAME>
value store: synchronizing
Trying to acquire lock on /omd/sites/monitoring_site/tmp/check_mk/counters/<HOSTNAME>
Got lock on /omd/sites/monitoring_site/tmp/check_mk/counters/<HOSTNAME>
value store: loading from disk
Releasing lock on /omd/sites/monitoring_site/tmp/check_mk/counters/<HOSTNAME>
Released lock on /omd/sites/monitoring_site/tmp/check_mk/counters/<HOSTNAME>
Checkmk version 2.3.0p18
+ FETCHING DATA
  Source: SourceInfo(hostname='<HOSTNAME>', ipaddress='<IP>', ident='snmp', fetcher_type=<FetcherType.SNMP: 7>, source_type=<SourceType.HOST: 1>)
[cpu_tracking] Start [address]
Read from cache: SNMPFileCache(<HOSTNAME>, path_template=/omd/sites/monitoring_site/tmp/check_mk/data_source_cache/snmp/{mode}/{hostname}, max_age=MaxAge(checking=0, discovery=90.0, inventory=90.0), simulation=False, use_only_cache=False, file_cache_mode=1)
[cpu_tracking] Stop [address]
  Source: SourceInfo(hostname='<HOSTNAME>', ipaddress='<IP>', ident='piggyback', fetcher_type=<FetcherType.PIGGYBACK: 4>, source_type=<SourceType.HOST: 1>)
[cpu_tracking] Start [address]
Read from cache: NoCache(<HOSTNAME>, path_template=/dev/null, max_age=MaxAge(checking=0.0, discovery=0.0, inventory=0.0), simulation=False, use_only_cache=False, file_cache_mode=1)
No piggyback files for '<HOSTNAME>'. Skip processing.
No piggyback files for '<IP>'. Skip processing.
Get piggybacked data
[cpu_tracking] Stop [address]
[cpu_tracking] Start [address]
+ PARSE FETCHER RESULTS
  HostKey(hostname='<HOSTNAME>', source_type=<SourceType.HOST: 1>)  -> Add sections: []
  HostKey(hostname='<HOSTNAME>', source_type=<SourceType.HOST: 1>)  -> Add sections: []
Received no piggyback data
No piggyback files for '<HOSTNAME>'. Skip processing.
No piggyback files for '<IP>'. Skip processing.
[cpu_tracking] Stop [address]
value store: synchronizing
Trying to acquire lock on /omd/sites/monitoring_site/tmp/check_mk/counters/<HOSTNAME>
Got lock on /omd/sites/monitoring_site/tmp/check_mk/counters/<HOSTNAME>
value store: already loaded
Releasing lock on /omd/sites/monitoring_site/tmp/check_mk/counters/<HOSTNAME>
Released lock on /omd/sites/monitoring_site/tmp/check_mk/counters/<HOSTNAME>
[snmp] Success, [piggyback] Success (but no data found for this host), execution time 0.0 sec | execution_time=0.000 user_time=0.000 system_time=0.000 children_user_time=0.000 children_system_time=0.000 cmk_time_snmp=0.000 cmk_time_agent=0.000


My Script:

#!/usr/bin/env python3

from cmk.agent_based.v2 import (
    CheckPlugin,
    startswith,
    Result,
    Service,
    SimpleSNMPSection,
    SNMPTree,
    State,
    exists,
)

def parse_vega_hwstatus(string_table):
    import sys
    print("DEBUG: parse_vega_hwstatus got string_table:", string_table, file=sys.stderr)
    # Maps for labels and values by index
    label_map = {}
    value_map = {}
    for row in string_table:
        for oid, val in row:
            if oid.startswith('.1.3.6.1.4.1.14988.1.1.3.100.1.2.'):
                index = oid.split('.')[-1]
                label_map[index] = val
            elif oid.startswith('.1.3.6.1.4.1.14988.1.1.3.100.1.3.'):
                index = oid.split('.')[-1]
                value_map[index] = val
    # Build sensor dict: {label: value}
    sensor_map = {}
    for index, label in label_map.items():
        if index in value_map:
            try:
                sensor_map[label] = float(value_map[index])
            except Exception:
                pass  # skip if value isn't a number
    return sensor_map

# Fetch both the label and value OID trees dynamically
snmp_section_vega_hwstatus = SimpleSNMPSection(
    name="vega_hwstatus",
    parse_function=parse_vega_hwstatus,
    detect=startswith(".1.3.6.1.4.1.14988.1.1.3.100.1.", ""),
    fetch=[
        SNMPTree(base='.1.3.6.1.4.1.14988.1.1.3.100.1.2', oids=[]),  # labels (dynamic)
        SNMPTree(base='.1.3.6.1.4.1.14988.1.1.3.100.1.3', oids=[]),  # values (dynamic)
    ]
)

def discover_vega_hwstatus(section):
    # section is sensor_map: {label: value}
    for label in section:
        # Only show the services you want (including fan speed!)
        if any(x in label.lower() for x in ['temp', 'fan']):
            yield Service(item=label)

def check_vega_hwstatus(item, params, section):
    thresholds = params.get("temperature_levels", (75, 90))  # (warn, crit)
    warn, crit = thresholds

    value = section.get(item)
    if value is None:
        yield Result(state=State.UNKNOWN, summary=f"No value for {item}")
        return

    # Set rules for temperature and fan speed
    if "temp" in item.lower():
        if value >= crit:
            state = State.CRIT
        elif value >= warn:
            state = State.WARN
        else:
            state = State.OK
        yield Result(state=state, summary=f"{item} is {value} °C (warn {warn}, crit {crit})")
    elif "fan" in item.lower():
        # Example: treat 0 as CRIT for fan, otherwise OK
        state = State.CRIT if value == 0 else State.OK
        yield Result(state=state, summary=f"{item} is {value} RPM")
    else:
        # Default: just show value OK
        yield Result(state=State.OK, summary=f"{item} is {value}")

check_plugin = CheckPlugin(
    name="vega_hwstatus",
    service_name="Vega %s",
    sections=["vega_hwstatus"],
    discovery_function=discover_vega_hwstatus,
    check_function=check_vega_hwstatus,
    check_default_parameters={"temperature_levels": (75, 90)},
    check_ruleset_name="vega_hwstatus",
)

Output of “cmk --debug -vvn hostname”:

OMD[monitoring_site]:~/local/lib/check_mk/base/plugins/agent_based$ cmk --debug -vvn HOSTNAME
value store: synchronizing
Trying to acquire lock on /omd/sites/monitoring_site/tmp/check_mk/counters/HOSTNAME
Got lock on /omd/sites/monitoring_site/tmp/check_mk/counters/HOSTNAME
value store: loading from disk
Releasing lock on /omd/sites/monitoring_site/tmp/check_mk/counters/HOSTNAME
Released lock on /omd/sites/monitoring_site/tmp/check_mk/counters/HOSTNAME
Checkmk version 2.3.0p18
+ FETCHING DATA
  Source: SourceInfo(hostname='HOSTNAME', ipaddress='IP', ident='snmp', fetcher_type=<FetcherType.SNMP: 7>, source_type=<SourceType.HOST: 1>)
[cpu_tracking] Start [address]
Read from cache: SNMPFileCache(HOSTNAME, path_template=/omd/sites/monitoring_site/tmp/check_mk/data_source_cache/snmp/{mode}/{hostname}, max_age=MaxAge(checking=0, discovery=90.0, inventory=90.0), simulation=False, use_only_cache=False, file_cache_mode=6)
Not using cache (Too old. Age is 49 sec, allowed is 0 sec)
  SNMP scan:
       Getting OID .1.3.6.1.2.1.1.1.0: Running 'snmpget -v3 -l noAuthNoPriv -u public -m "" -M "" -On -OQ -Oe -Ot IP .1.3.6.1.2.1.1.1.0'
SNMP answer: ==> ["RouterOS CRS310-8G+2S+"]
b'RouterOS CRS310-8G+2S+'
       Getting OID .1.3.6.1.2.1.1.2.0: Running 'snmpget -v3 -l noAuthNoPriv -u public -m "" -M "" -On -OQ -Oe -Ot IP .1.3.6.1.2.1.1.2.0'
SNMP answer: ==> [.1.3.6.1.4.1.14988.1]
b'.1.3.6.1.4.1.14988.1'
       Using cached OID .1.3.6.1.2.1.1.1.0: 'RouterOS CRS310-8G+2S+'
       Using cached OID .1.3.6.1.2.1.1.2.0: '.1.3.6.1.4.1.14988.1'
       ... (output truncated for brevity, replace all sensitive info)
[snmp] Success, [piggyback] Success (but no data found for this host), execution time 0.9 sec | execution_time=0.860 user_time=0.030 system_time=0.000 children_user_time=0.090 children_system_time=0.070 cmk_time_snmp=0.670 cmk_time_agent=0.000

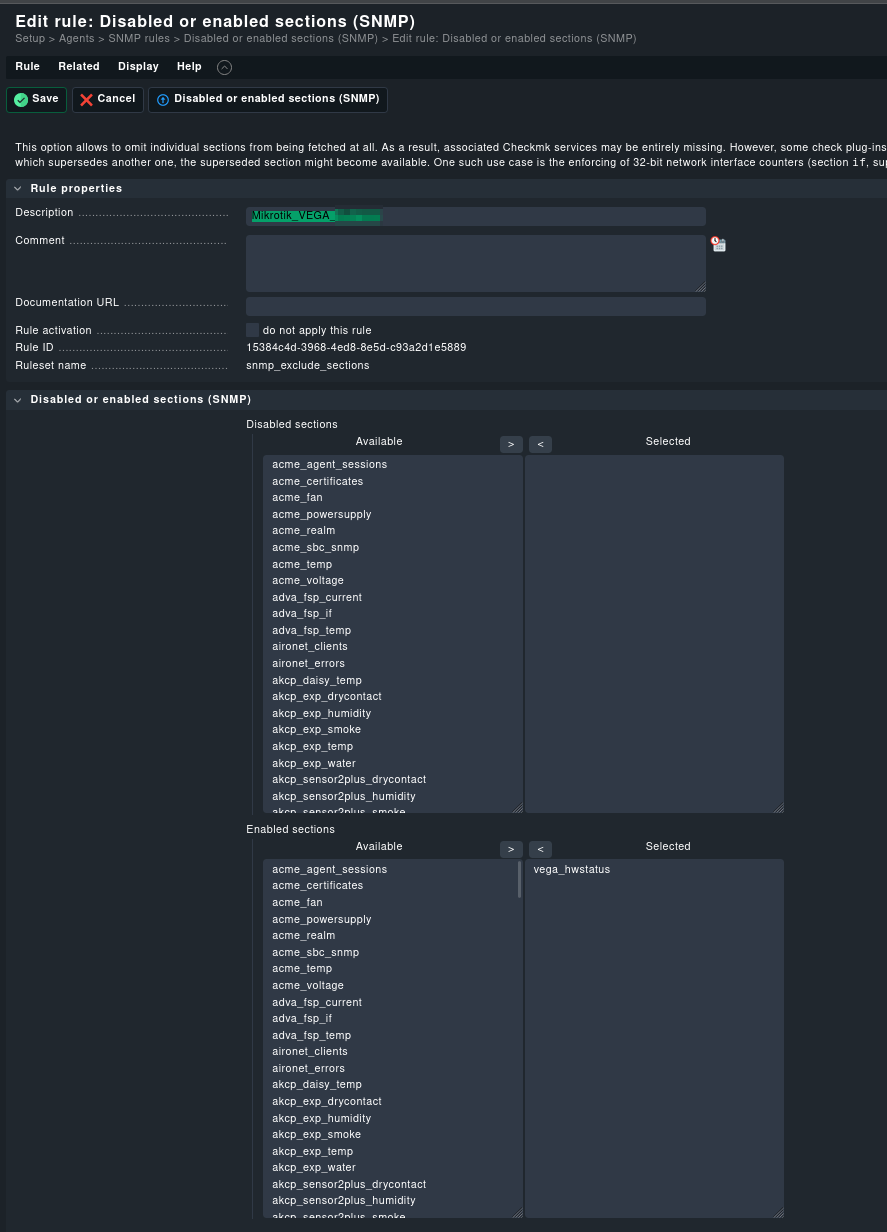
Can someone help me figure out why my plugin isn’t reading the OID data, even though normal SNMP walks work?

Just as a Heads up Normal SNMP-Monitoring works, its just this custom one for Temperatures.

If you need more details or direct SNMP walk outputs, let me know!

Thanks a lot!

Best regards
Jan

In the message below i see no error message. What is missing in your command is to do first an discovery of your check. This needs to be done with “-I” ← capital i.
But i would not recommend to use the “–detect-plugins” options. This will hide that your “detect” statements inside the “SimpleSNMPSection” is potential not working.
Instead of “startswith” you should use “exists” if you only want to check that this OID is existing.

After you have found a new service with the service discovery, you can run your command again without the “-I” and you should see something. Check result or error message :wink:

1 Like

Continuing the discussion from Unable to send SNMP Check-Data to WebGUI:

Hey, thanks for the quick reply!

I did what you suggested and got a bit further, but it’s still not working fully:

Command output:

cmk --debug -vI --no-cache <Hostname> 
Discovering services and host labels on: <Hostname> 
<Hostname>:
+ FETCHING DATA
No piggyback files for '<Hostname> '. Skip processing.
No piggyback files for '<IP>'. Skip processing.
Get piggybacked data
+ ANALYSE DISCOVERED HOST LABELS
SUCCESS - Found no new host labels
+ ANALYSE DISCOVERED SERVICES
+ EXECUTING DISCOVERY PLUGINS (10)
SUCCESS - Found no new services

What improved:

I moved my custom plugin into the correct directory, and now the section actually appears in the GUI.

File-Path:

/opt/omd/sites/vega_monitoring/local/lib/python3/cmk_addons/plugins/Mikrotik/agent_based/vega_hwstatus.py

GUI confirmation:

Plugin snippet (As reccomended):

snmp_section_vega_hwstatus = SimpleSNMPSection(
    name="vega_hwstatus",
    parse_function=parse_vega_hwstatus,
    detect = exists('.1.3.6.1.4.1.14988.1.1.3.100.1'),
    fetch = SNMPTree(
            base='.1.3.6.1.4.1.14988.1.1.3.100.1',
            oids=['2.17', '3.17', '2.50', '3.50', '2.52', '3.50', '2.54', '2.54', '2.7001', '3.7001', '2.7101', '3.7101']
            ),  # labels (hardcoded)
)

But:
When I run discovery, I still get “SUCCESS - Found no new services.”

What else I tried

  • My SNMP walk confirms that the OIDs exist and return data.
  • The section is enabled for the host in the GUI (see screenshot).
  • I tried adding debug print statements in my parser, but they don’t print anything.
  • I have a discovery and check function, and the check is registered with CheckPlugin.

Main question:

Is there a reason why the section is enabled, OIDs exist, but the parser never seems to run/discover anything?
Is my fetch or detect syntax somehow still wrong for this Checkmk version (2.3.0p18, Raw Edition)?

Any ideas for what I could be missing to actually get services to show up?
(Or if someone has a minimal example for SNMP “table” sections that works on this version, that’d be awesome.)

Thanks for all the help so far!

If you do this command with “-vvI” you should see a little bit more.
Important are these parts.

  Source: SourceInfo(hostname='Hostname', ipaddress='HOST-IP', ident='snmp', fetcher_type=<FetcherType.SNMP: 7>, source_type=<SourceType.HOST: 1>)
[cpu_tracking] Start [79388b74bb30]

Here you see that the system tries to fetch data with SNMP.
Next there is a long list of OIDs checked.
Something like this.

       Using cached OID .1.3.6.1.2.1.1.2.0: '.1.3.6.1.4.1.8072.3.2.10'
       Using cached OID .1.3.6.1.2.1.1.1.0: 'Linux NAS 4.4.302+ #72806 SMP Thu Sep 5 13:44:44 CST 2024 x86_64'
       Using cached OID .1.3.6.1.2.1.1.2.0: '.1.3.6.1.4.1.8072.3.2.10'
       Using cached OID .1.3.6.1.2.1.1.2.0: '.1.3.6.1.4.1.8072.3.2.10'

At the end of this list you should find a line.

 SNMP scan found

With some plugins that it tries to discover.
Here you should also see the name of your SNMP section.
Then CMK tries to fetch the data for these plugins.

Executing BULKWALK (v2c) of ".1.3.6.1.2.1.25.3.3.1.2" on Hostname
.1.3.6.1.2.1.25.3.3.1.2.196608 => [b'2'] 'INTEGER'
.1.3.6.1.2.1.25.3.3.1.2.196609 => [b'3'] 'INTEGER'
.1.3.6.1.2.1.25.3.3.1.2.196610 => [b'4'] 'INTEGER'
.1.3.6.1.2.1.25.3.3.1.2.196611 => [b'3'] 'INTEGER'

Nearly at the end you should see

Trying discovery with: 

And also here you should see the names of the plugins it tries to use.

1 Like

For the detect function you should not use device specific oids as this requires to fetch this oid from every host monitored in your CheckMK deployment when doing a discovery. A better way is to use a generic oid which allows you to detect if your plugin maybe useable for a host. So use something like this:

detect=contains(“.1.3.6.1.2.1.1.1.0”, “MikroTik”)

If and what your device provide on this oid could be found in the cmk snmpwalk

2 Likes

Good Evening,

I tried a few different things and I’ve got this far now:

The Check now seems to register when doing

cmk --debug -vvvI --no-cache hostname

Output “Truncated”

[cpu_tracking] Stop [7f1cbc5bd760 - Snapshot(process=posix.times_result(user=0.13000000000000012, system=0.01999999999999999, children_user=0.21, children_system=0.12, elapsed=1.3200000002980232))]
  Source: SourceInfo(hostname='Hostname', ipaddress='IP', ident='piggyback', fetcher_type=<FetcherType.PIGGYBACK: 4>, source_type=<SourceType.HOST: 1>)
[cpu_tracking] Start [7f1cbc3754f0]
Read from cache: NoCache(Hostname, path_template=/dev/null, max_age=MaxAge(checking=0.0, discovery=0.0, inventory=0.0), simulation=False, use_only_cache=False, file_cache_mode=1)
No piggyback files for 'Hostname'. Skip processing.
No piggyback files for 'IP'. Skip processing.
Get piggybacked data
[cpu_tracking] Stop [7f1cbc3754f0 - Snapshot(process=posix.times_result(user=0.0, system=0.0, children_user=0.0, children_system=0.0, elapsed=0.0))]
+ PARSE FETCHER RESULTS
  HostKey(hostname='Hostname', source_type=<SourceType.HOST: 1>)  -> Add sections: ['hr_cpu', 'hr_fs', 'hr_mem', 'hr_ps', 'if', 'if64', 'inv_if', 'mikrotik_signal', 'snmp_extended_info', 'snmp_info', 'snmp_uptime', 'vega_hwstatus']
  HostKey(hostname='Hostname', source_type=<SourceType.HOST: 1>)  -> Add sections: []
Received no piggyback data
+ ANALYSE DISCOVERED HOST LABELS
Trying host label discovery with: hr_cpu, hr_fs, hr_mem, hr_ps, if64, inv_if, mikrotik_signal, snmp_extended_info, snmp_info, snmp_uptime, vega_hwstatus
  cmk/device_type: router (snmp_info)
  cmk/device_type: router (snmp_extended_info)
Trying host label discovery with: 
SUCCESS - Found no new host labels
+ ANALYSE DISCOVERED SERVICES
+ EXECUTING DISCOVERY PLUGINS (10)
  Trying discovery with: docker_container_status_uptime, snmp_info, mikrotik_signal, hr_ps, if64, ps, uptime, hr_cpu, hr_fs, mem_used
SUCCESS - Found no new services

I also implemented the “contains” command as Suggested:

Here’s my current Fetch code:

# Fetch both the label and value OID trees dynamically
snmp_section_vega_hwstatus = SimpleSNMPSection(
        name="vega_hwstatus",
        parse_function=parse_vega_hwstatus,
        detect = contains('.1.3.6.1.2.1.1.5.0', 'Hostname'),
        fetch = SNMPTree(
            base='.1.3.6.1.4.1.14988.1.1.3.100.1',
            oids=['2.17', '3.17', '2.50', '3.50', '2.52', '3.50', '2.54', '2.54', '2.7001', '3.7001', '2.7101', '3.7101']
            ),  # labels (hardcoded)
        )

“It seems to register correctly now, but my check function is not receiving any values to process.”

To detect on the hostname might be ok for now, but is not the way to write a plugin as it is specific for your single device. Better would be to use .1.3.6.1.2.1.1.1.0 and trigger with contains on anything in there that are device type specific like the company name. Check for the content of .1.3.6.1.2.1.1.1.0 with snmpwalk to select something useful.
In your output I can’t see any snmp requests. Did you truncate this? If not: Is the host in checkmk configured to do snmp?

Your section was found, that is good.
Now the question is - does your parse section produces an valid output.
Here you should first insert a little bit of debug code that outputs first the “string_table” and also what you want to return. In your case the “sensor_map”.
If “sensor_map” is an empty dict then it is clear that no service is found.

I think that it is an empty output as later you see that there is no discovery called for your plugin.

Yeah its detecting but my Parser is not doing anything, even if i do a Print statement at the beginning:

My Current Code with Print statements:

from cmk.agent_based.v2 import (
        CheckPlugin,
        Result,
        Service,
        SimpleSNMPSection,
        SNMPTree,
        State,
        contains,
        )

def parse_vega_hwstatus(string_table):
            print ("TEST string_table", string_table)
            # Replace LABELS with your actual meaning per OID
            labels = [row[0] for i, row in enumerate(string_table) if i % 2 == 0]
            values = [row[0] for i, row in enumerate(string_table) if i % 2 == 1]
            sensor_map = dict(zip(labels, values))
            print ("test 1 sensor_map", sensor_map)
            yield sensor_map

detect = contains('.1.3.6.1.2.1.1.5.0', 'VEGA-SWT003')
print ("test 2 detect Contains", detect)

fetch = SNMPTree(
            base='.1.3.6.1.4.1.14988.1.1.3.100.1',
            oids=[
            '2.17', '2.50', '2.52', '2.54', '2.7001', '2.7101',
            '3.17', '3.50', '3.52', '3.54', '3.7001', '3.7101',
            ]
            )  # labels (hardcoded)
print ("test 3 fetch", fetch)


# Fetch both the label and value OID trees dynamically
snmp_section_vega_hwstatus = SimpleSNMPSection(
        name="vega_hwstatus",
        parse_function=parse_vega_hwstatus,
        detect = detect,
        fetch = fetch,
        )


def discover_vega_hwstatus(section):
    # section: list of dicts: [ {label: value, ...} ]
            print ("test 4 section", section)
            for sensor_map in section:
                for label in sensor_map:
                    print("test 5 label", label)
                    if any(x in label.lower() for x in ['temp', 'fan']):
                        yield Service(item=label)

def check_vega_hwstatus(item, params, section):
    thresholds = params.get("temperature_levels", (75, 90))  # (warn, crit)
    warn, crit = thresholds

    if not section or not isinstance(section[0], dict):
        yield Result(state=State.UNKNOWN, summary="No data returned")
        return

    sensor_map = section[0]
    value = sensor_map.get(item)
    if value is None:
        yield Result(state=State.UNKNOWN, summary=f"No value for {item}")
        return

    try:
        value = float(value)
    except Exception:
        yield Result(state=State.UNKNOWN, summary=f"Value for {item} is not a number: {value}")
        return

    if "temp" in item.lower():
        if value >= crit:
            state = State.CRIT
        elif value >= warn:
            state = State.WARN
        else:
            state = State.OK
        yield Result(state=state, summary=f"{item} is {value} °C (warn {warn}, crit {crit})")
    elif "fan" in item.lower():
        state = State.CRIT if value == 0 else State.OK
        yield Result(state=state, summary=f"{item} is {value} RPM")
    else:
        yield Result(state=State.OK, summary=f"{item} is {value}")

CheckPlugin(
        name="vega_hwstatus",
        service_name="Vega %s",
    sections=["vega_hwstatus"],
        discovery_function=discover_vega_hwstatus,
        check_function=check_vega_hwstatus,
        check_default_parameters={"temperature_levels": (75, 90)},
        check_ruleset_name="vega_hwstatus",
        )

The Prints which i do get are these:

OMD[vega_monitoring]:~/local/lib/python3/cmk_addons/plugins/Mikrotik/agent_based$ cmk --debug -vvvI --no-cache HOSTNAME  | grep test
test 2 detect Contains [[('.1.3.6.1.2.1.1.5.0', '.*HOSTNAME*', True)]]
test 3 fetch SNMPTree(base='.1.3.6.1.4.1.14988.1.1.3.100.1', oids=[_OIDSpecTuple(column='2.17', encoding='string', save_to_cache=False), _OIDSpecTuple(column='2.50', encoding='string', save_to_cache=False), _OIDSpecTuple(column='2.52', encoding='string', save_to_cache=False), _OIDSpecTuple(column='2.54', encoding='string', save_to_cache=False), _OIDSpecTuple(column='2.7001', encoding='string', save_to_cache=False), _OIDSpecTuple(column='2.7101', encoding='string', save_to_cache=False), _OIDSpecTuple(column='3.17', encoding='string', save_to_cache=False), _OIDSpecTuple(column='3.50', encoding='string', save_to_cache=False), _OIDSpecTuple(column='3.52', encoding='string', save_to_cache=False), _OIDSpecTuple(column='3.54', encoding='string', save_to_cache=False), _OIDSpecTuple(column='3.7001', encoding='string', save_to_cache=False), _OIDSpecTuple(column='3.7101', encoding='string', save_to_cache=False)])

As this Switch is Uniqe im going with this but true a more Uniqe would be more fitting.

The -I option of cmk does only add new services found. So to make sure we do not miss anything use -II which will relearn all. And if the service is detected use it without any “I” option to trigger the check itself. I still wonder why we do not see a single snmp request in yout output. Thats unusual. Could you please share the Setup properties of your host?

Sorry if I’m being a bit slow, just want to make sure I’m giving the right info, you mean the setup of the device I’m trying to monitor in Checkmk, right?

It’s a switch, and its host setup looks like this in Checkmk:

By the way it also does not matter if i use -vvv or -vvvII

OMD[vega_monitoring]:~$ cmk --debug -vvv --no-cache HOSTNAME | grep -i test
test 2 detect Contains [[('.1.3.6.1.2.1.1.5.0', '.*Hostname*', True)]]
test 3 fetch SNMPTree(base='.1.3.6.1.4.1.14988.1.1.3.100.1', oids=[_OIDSpecTuple(column='2.17', encoding='string', save_to_cache=False), _OIDSpecTuple(column='2.50', encoding='string', save_to_cache=False), _OIDSpecTuple(column='2.52', encoding='string', save_to_cache=False), _OIDSpecTuple(column='2.54', encoding='string', save_to_cache=False), _OIDSpecTuple(column='2.7001', encoding='string', save_to_cache=False), _OIDSpecTuple(column='2.7101', encoding='string', save_to_cache=False), _OIDSpecTuple(column='3.17', encoding='string', save_to_cache=False), _OIDSpecTuple(column='3.50', encoding='string', save_to_cache=False), _OIDSpecTuple(column='3.52', encoding='string', save_to_cache=False), _OIDSpecTuple(column='3.54', encoding='string', save_to_cache=False), _OIDSpecTuple(column='3.7001', encoding='string', save_to_cache=False), _OIDSpecTuple(column='3.7101', encoding='string', save_to_cache=False)])
OMD[vega_monitoring]:~$ cmk --debug -vvvII --no-cache HOSTNAME | grep -i test
test 2 detect Contains [[('.1.3.6.1.2.1.1.5.0', '.*HOSTNAME*', True)]]
test 3 fetch SNMPTree(base='.1.3.6.1.4.1.14988.1.1.3.100.1', oids=[_OIDSpecTuple(column='2.17', encoding='string', save_to_cache=False), _OIDSpecTuple(column='2.50', encoding='string', save_to_cache=False), _OIDSpecTuple(column='2.52', encoding='string', save_to_cache=False), _OIDSpecTuple(column='2.54', encoding='string', save_to_cache=False), _OIDSpecTuple(column='2.7001', encoding='string', save_to_cache=False), _OIDSpecTuple(column='2.7101', encoding='string', save_to_cache=False), _OIDSpecTuple(column='3.17', encoding='string', save_to_cache=False), _OIDSpecTuple(column='3.50', encoding='string', save_to_cache=False), _OIDSpecTuple(column='3.52', encoding='string', save_to_cache=False), _OIDSpecTuple(column='3.54', encoding='string', save_to_cache=False), _OIDSpecTuple(column='3.7001', encoding='string', save_to_cache=False), _OIDSpecTuple(column='3.7101', encoding='string', save_to_cache=False)])

Don’t do any grep in such tests. This will hide error messages that could be seen with “–debug”.

From the formatting of your code i would say it will not run correctly.

With an snmpwalk dump from such a device it will be easier to say where the real problem is.

Just FYI to all regarding grep, hoping someone finds it useful:

At least on Linux one can use the additional parameters
B” for “Before” and “A” for “After”, and a number of lines e.g.:

<CMD> | grep -B2 -A2 -i test

The output of such a command, filtered with grep will also include
two lines before the match and two lines after it.

:slight_smile:
Thomas

Hey :smiley:

Short update / solution:

I checked “my” Python script with a buddy from work (he’s a dev), and he got it working!
Turns out, some parts aren’t really described in the Checkmk wiki, but he found extra details by digging into the Checkmk codebase.

So for anyone wanting to monitor temperature sensors on a Mikrotik switch — here’s the working script:

#!/usr/bin/env python3

from cmk.agent_based.v2 import (
        CheckPlugin,
        Result,
        Service,
        SimpleSNMPSection,
        SNMPTree,
        State,
        contains,
        check_levels,
        Metric
        )

def parse_vega_hwstatus(string_table):
  print("TEST string_table", string_table)

  # All data is in the first row
  if string_table and string_table[0]:
      data = string_table[0]

      # Extract alternating elements as labels and values
      labels = [data[i] for i in range(0, len(data), 2)]
      values = [data[i] for i in range(1, len(data), 2)]

      sensor_map = dict(zip(labels, values))
      print("test 1 sensor_map", sensor_map)
      return [sensor_map]


detect = contains('.1.3.6.1.2.1.1.5.0', 'HOSTNAME')
print ("test 2 detect Contains", detect)

fetch = SNMPTree(
            base='.1.3.6.1.4.1.14988.1.1.3.100.1',
            oids=[
            '2.17', '3.17', '2.50', '3.50', '2.52', '3.52', '2.54', '3.54', '2.7001', '3.7001', '2.7101', '3.7101'
            ]
            )  # labels (hardcoded)
print ("test 3 fetch", fetch)


# Fetch both the label and value OID trees dynamically
snmp_section_vega_hwstatus = SimpleSNMPSection(
        name="vega_hwstatus",
        parsed_section_name="vega_hwstatus",
        parse_function=parse_vega_hwstatus,
        detect = detect,
        fetch = fetch,
        )


def discover_vega_hwstatus(section):
    # section: list of dicts: [ {label: value, ...} ]
            print ("test 4 section", section)
            for sensor_map in section:
                for label in sensor_map:
                    print("test 5 label", label)
                    if any(x in label.lower() for x in ['temp', 'fan']):
                        yield Service(item=label)

def check_vega_hwstatus(item, params, section):
    thresholds = params.get("temperature_levels", (75, 90))  # (warn, crit)
    warn, crit = thresholds
    
    if not section:
        yield Result(state=State.UNKNOWN, summary="No data b4 Conversion")
        return
    
    if not section:
        yield Result(state=State.UNKNOWN, summary="No data returned")
        return 
        
    if not isinstance(section[0], dict):
        yield Result(state=State.UNKNOWN, summary="Data is not a Dict")
        return

    sensor_map = section[0]
    value = sensor_map.get(item)
    if value is None:
        yield Result(state=State.UNKNOWN, summary=f"No value for {item}")
        return

    try:
        if item.lower() in "fan-state":
            value = int(value)
            value = "OK" if value == 0 else "CRITICAL"
        else:
            value = float(value)
    except Exception:
        yield Result(state=State.UNKNOWN, summary=f"Value for {item} is not a number: {value}")
        return

    if "temp" in item.lower():
        if value >= crit:
           state = State.CRIT
        elif value >= warn:
            state = State.WARN
        else:
            state = State.OK
        yield Result(state=state, summary=f"{item} is {value} °C (warn {warn}, crit {crit})")
        yield Metric(
            name = item.lower(),
            value = value,
            levels = (75.0, 90.0),
            boundaries = (0.0, 110.0)
        )
    elif "fan" in item.lower():
        if "fan-state" in item.lower():
            state = State.OK if value == "OK" else State.CRIT
            yield Result(state=state, summary=f"{item} is {value}")
        else:
            state = State.CRIT if value == 0 else State.OK
            yield Result(state=state, summary=f"{item} is {value} RPM")
            yield Metric(
                name = item.lower(),
                value = value,
                levels = (6000, 7000),
                boundaries = (0.0, 8000)
            )
    else:
        yield Result(state=State.OK, summary=f"{item} is {value}")

check_plugin_vega_hwstatus = CheckPlugin(
        name="vega_hwstatus",
        service_name="%s",
        sections=["vega_hwstatus"],
        discovery_function=discover_vega_hwstatus,
        check_function=check_vega_hwstatus,
        check_default_parameters={"temperature_levels": (75, 90)},
        check_ruleset_name="vega_hwstatus",
        )

It now gets detected, and I can read out the temps:

Notes:

  • I’m using detect = contains('.1.3.6.1.2.1.1.5.0', 'HOSTNAME') for now, but I’ll likely switch to something based on the model name in the future.
  • Perf-O-Meter is next on the to-do list.
  • If anyone has improvements or suggestions, I’m all ears! :smiley:
1 Like

I took your code and made it a bit more universal.
The biggest problem are the “hard coded” OIDend values.

It is better to fetch the complete table as it has only three columns.

These OID values can be very different from device to device.
I found some SNMPwalks on the internet where i had these different types.


In this check i use the ID of the sensor as the unique key for the discovery.

What i have also done is the separation for the different types of checks.
But that is more a nice to have.

#!/usr/bin/env python3
# -*- coding: utf-8 -*-
"""this check plugin is for Mikrotik RouterOS hardware status"""
# (c) Andreas Doehler <andreas.doehler@bechtle.com/andreas.doehler@gmail.com>
# License: GNU General Public License v2

from typing import Any, Dict, Optional

from cmk.agent_based.v2 import (
    CheckPlugin,
    CheckResult,
    DiscoveryResult,
    OIDEnd,
    Result,
    Service,
    SimpleSNMPSection,
    SNMPTree,
    State,
    check_levels,
    get_value_store,
    startswith,
)
from cmk.plugins.lib.temperature import TempParamDict, check_temperature
from typing_extensions import TypedDict

Section = Dict[str, Any]
TwoLevelsType = tuple[str, tuple[float | None, float | None]]


class MikrotikParamDict(TypedDict, total=False):
    """Parameter from generic Mikrotik Rule"""

    levels: TwoLevelsType
    levels_lower: TwoLevelsType


def parse_mikrotik_hwstatus(string_table) -> Optional[Section]:
    """Parse the SNMP data for mikrotik hardware status."""
    sensor_type = {
        "1": ("temperature", "°C", 1.0),
        "2": ("fan", "RPM", 1.0),
        "3": ("voltage", "V", 0.1),
        "4": ("current", "A", 0.1),
        "5": ("power", "W", 0.1),
        "6": ("psu-state", "", 1),
    }

    parsed = {}
    for row in string_table:
        index = row[0]
        name = row[1]
        value = int(row[2])
        sensor_type_value, unit, factor = sensor_type.get(
            str(row[3]), ("unknown", "", 1)
        )
        parsed[index] = {
            "name": name,
            "value": value,
            "type": sensor_type_value,
            "unit": unit,
            "factor": factor,
        }
    return parsed


snmp_section_mikrotik_hwstatus = SimpleSNMPSection(
    name="mikrotik_hwstatus",
    parsed_section_name="mikrotik_hwstatus",
    parse_function=parse_mikrotik_hwstatus,
    detect=startswith(".1.3.6.1.2.1.1.2.0", ".1.3.6.1.4.1.14988"),
    fetch=SNMPTree(
        base=".1.3.6.1.4.1.14988.1.1.3.100.1",
        oids=[
            OIDEnd(),
            "2",
            "3",
            "4",
        ],
    ),
)


def discover_mikrotik_hwstatus(params, section: Optional[Section]) -> DiscoveryResult:
    """Discovers one item for each sensor in the mikrotik hardware status."""
    if section:
        for index, sensor in section.items():
            if sensor.get("type") == params.get("type"):
                yield Service(item=f"{index} {sensor['name']}")


def check_mikrotik_hwstatus(item: str, params: MikrotikParamDict, section: Section) -> CheckResult:
    """Check the status of mikrotik hardware sensors."""
    data = section.get(item.split(" ")[0])
    if not data:
        return

    sensor_name = data.get("name", "unknown")
    factor = data.get("factor", 1.0)
    unit = data.get("unit", "")
    sensor_type_value = data.get("type", "unknown")
    value = data.get("value", None)

    yield from check_levels(
        value=value * factor,
        metric_name=sensor_type_value,
        render_func=lambda v: f"{v:.2f} {unit}",
        label=sensor_name,
        levels_lower=params.get("levels_lower"),
        levels_upper=params.get("levels"),
    )


def check_mikrotik_hwstatus_temp(
    item: str, params: TempParamDict, section: Section
) -> CheckResult:
    """Check the temperature sensor in mikrotik hardware status."""
    data = section.get(item.split(" ")[0])
    if not data or data.get("type") != "temperature":
        return

    yield from check_temperature(
        data.get("value", 0) * data.get("factor", 1.0),
        params,
        unique_name=data.get("name", "---"),
        value_store=get_value_store(),
    )


def check_mikrotik_hwstatus_psu(item: str, section: Section) -> CheckResult:
    """Check the PSU state in mikrotik hardware status."""
    data = section.get(item.split(" ")[0])
    if not data or data.get("type") != "psu-state":
        return

    state = State.OK
    if data.get("value") == 1:
        state = State.WARN
    elif data.get("value") == 2:
        state = State.CRIT

    yield Result(
        state=state,
        summary=f"PSU {data.get('name', 'unknown')} is {'OK' if state == State.OK else 'not OK'}",
    )


check_plugin_mikrotik_hwstatus_temp = CheckPlugin(
    name="mikrotik_hwstatus_temp",
    sections=["mikrotik_hwstatus"],
    service_name="Temperature %s",
    discovery_function=discover_mikrotik_hwstatus,
    discovery_default_parameters={"type": "temperature"},
    discovery_ruleset_name="inventory_mikrotik_hwstatus",
    check_function=check_mikrotik_hwstatus_temp,
    check_default_parameters={},
    check_ruleset_name="temperature",
)

check_plugin_mikrotik_hwstatus_fan = CheckPlugin(
    name="mikrotik_hwstatus_fan",
    sections=["mikrotik_hwstatus"],
    service_name="Fan %s",
    discovery_function=discover_mikrotik_hwstatus,
    discovery_default_parameters={"type": "fan"},
    discovery_ruleset_name="inventory_mikrotik_hwstatus",
    check_function=check_mikrotik_hwstatus,
    check_default_parameters={},
    check_ruleset_name="mikrotik_hwstatus",
)

check_plugin_mikrotik_hwstatus_voltage = CheckPlugin(
    name="mikrotik_hwstatus_voltage",
    sections=["mikrotik_hwstatus"],
    service_name="Voltage %s",
    discovery_function=discover_mikrotik_hwstatus,
    discovery_default_parameters={"type": "voltage"},
    discovery_ruleset_name="inventory_mikrotik_hwstatus",
    check_function=check_mikrotik_hwstatus,
    check_default_parameters={},
    check_ruleset_name="mikrotik_hwstatus",
)

check_plugin_mikrotik_hwstatus_power = CheckPlugin(
    name="mikrotik_hwstatus_power",
    sections=["mikrotik_hwstatus"],
    service_name="Power %s",
    discovery_function=discover_mikrotik_hwstatus,
    discovery_default_parameters={"type": "power"},
    discovery_ruleset_name="inventory_mikrotik_hwstatus",
    check_function=check_mikrotik_hwstatus,
    check_default_parameters={},
    check_ruleset_name="mikrotik_hwstatus",
)

check_plugin_mikrotik_hwstatus_current = CheckPlugin(
    name="mikrotik_hwstatus_current",
    sections=["mikrotik_hwstatus"],
    service_name="Current %s",
    discovery_function=discover_mikrotik_hwstatus,
    discovery_default_parameters={"type": "current"},
    discovery_ruleset_name="inventory_mikrotik_hwstatus",
    check_function=check_mikrotik_hwstatus,
    check_default_parameters={},
    check_ruleset_name="mikrotik_hwstatus",
)

check_plugin_mikrotik_hwstatus_psu_state = CheckPlugin(
    name="mikrotik_hwstatus_psu_state",
    sections=["mikrotik_hwstatus"],
    service_name="PSU State %s",
    discovery_function=discover_mikrotik_hwstatus,
    discovery_default_parameters={"type": "psu-state"},
    discovery_ruleset_name="inventory_mikrotik_hwstatus",
    check_function=check_mikrotik_hwstatus_psu,
)
1 Like