From the github README:
Download mkp: https://github.com/grepmeister/universaljson/raw/refs/heads/main/assets/universaljson-1.0.2.mkp
Advantages over local check
-
Agent section data is structured JSON.
-
The agent can declare if the state is OK, WARNING, CRITICAL, or
UNKNOWN just like with local checks …
-
But in addition, you can configure service rules to override the
state if threshold values are exceeded or too low.
-
In other words: If you have metrics, you can configure thresholds on
the checkmk server for upper and lower limits  .
.
-
Unlike local checks it supports counters  !!!
!!!
-
You can emit your own details and summary, separatly.
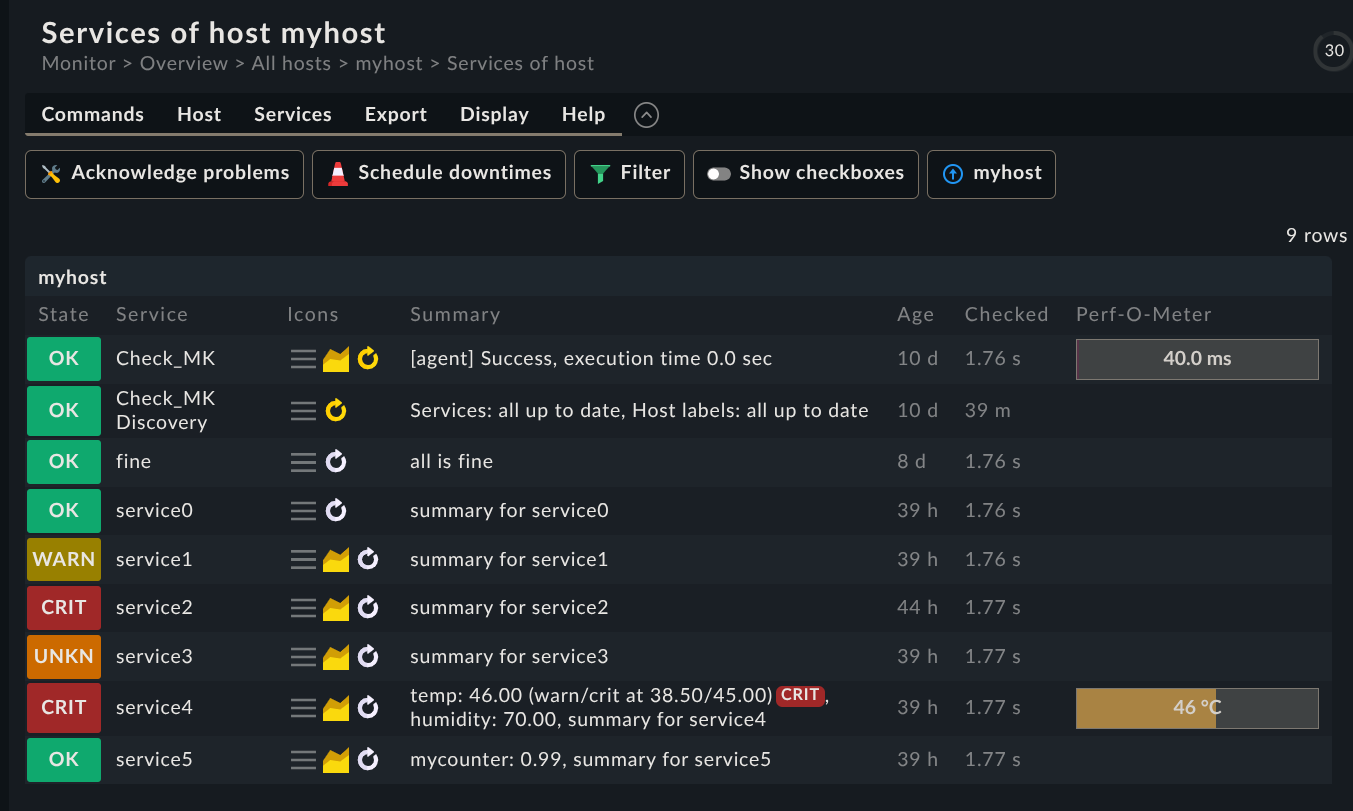
How does it work?
Example: One service with details summary in OK state
Simple example
<<<universaljson:sep(0)>>>
{"services":{"service0":{"summary":"summary for service0","details":"details for service0, expected to be OK","state":0}}}
As common with checkmk, the JSON is expected to be on one line in the agent output.
Human readable
{
  "services": {
    "service0": {
      "summary": "summary for service0",
      "details": "details for service0, expected to be OK",
      "state": 0
    }
  }
}
Above, it’s pretty printed to make it easier to understand the structure
of the JSON. The check plugin expects the JSON data on a single line!
You can format your JSON to a single line e.g. with:
jq -c < file.json
# or
jq --compact-output < file.json
Example: more complex JSON with multiple services
More complex JSON example
<<<universaljson:sep(0)>>>
{"services":{"service0":{"summary":"summary for service0","details":"details for service0, expected to be OK","state":0},"service1":{"summary":"summary for service1","details":"details for service1, expected to be WARN","state":1},"service2":{"summary":"summary for service2","details":"details for service2, expected to be CRIT","state":2},"service3":{"summary":"summary for service3","details":"details for service3, expected to be UNK","state":3},"service4":{"state":0,"summary":"summary for service4","details":"details for service4","metrics":{"temp":46,"humidity":70}},"service5":{"summary":"summary for service5","details":"details for service5, it's a counter","metrics":{"mycounter":"1754224044c"}}}}
Human readable
{
  "services": {
    "service0": {
      "summary": "summary for service0",
      "details": "details for service0, expected to be OK",
      "state": 0
    },
    "service1": {
      "summary": "summary for service1",
      "details": "details for service1, expected to be WARN",
      "state": 1
    },
    "service2": {
      "summary": "summary for service2",
      "details": "details for service2, expected to be CRIT",
      "state": 2
    },
    "service3": {
      "summary": "summary for service3",
      "details": "details for service3, expected to be UNK",
      "state": 3
    },
    "service4": {
      "state": 0,
      "summary": "summary for service4",
      "details": "details for service4",
      "metrics": {
        "temp": 46.0,
        "humidity": 70.0
      }
    },
    "service5": {
      "summary": "summary for service5",
      "details": "details for service5, it's a counter",
      "metrics": {
        "mycounter": "1754143835c"
      }
    }
  }
}
-
service4 generates two float metrics temp and humidity.
-
service5 generates a metric which is actually a counter
because it’s a JSON string and not a float (using "quotes") and
has a suffix of c, like it was common in nagios compatible checks.
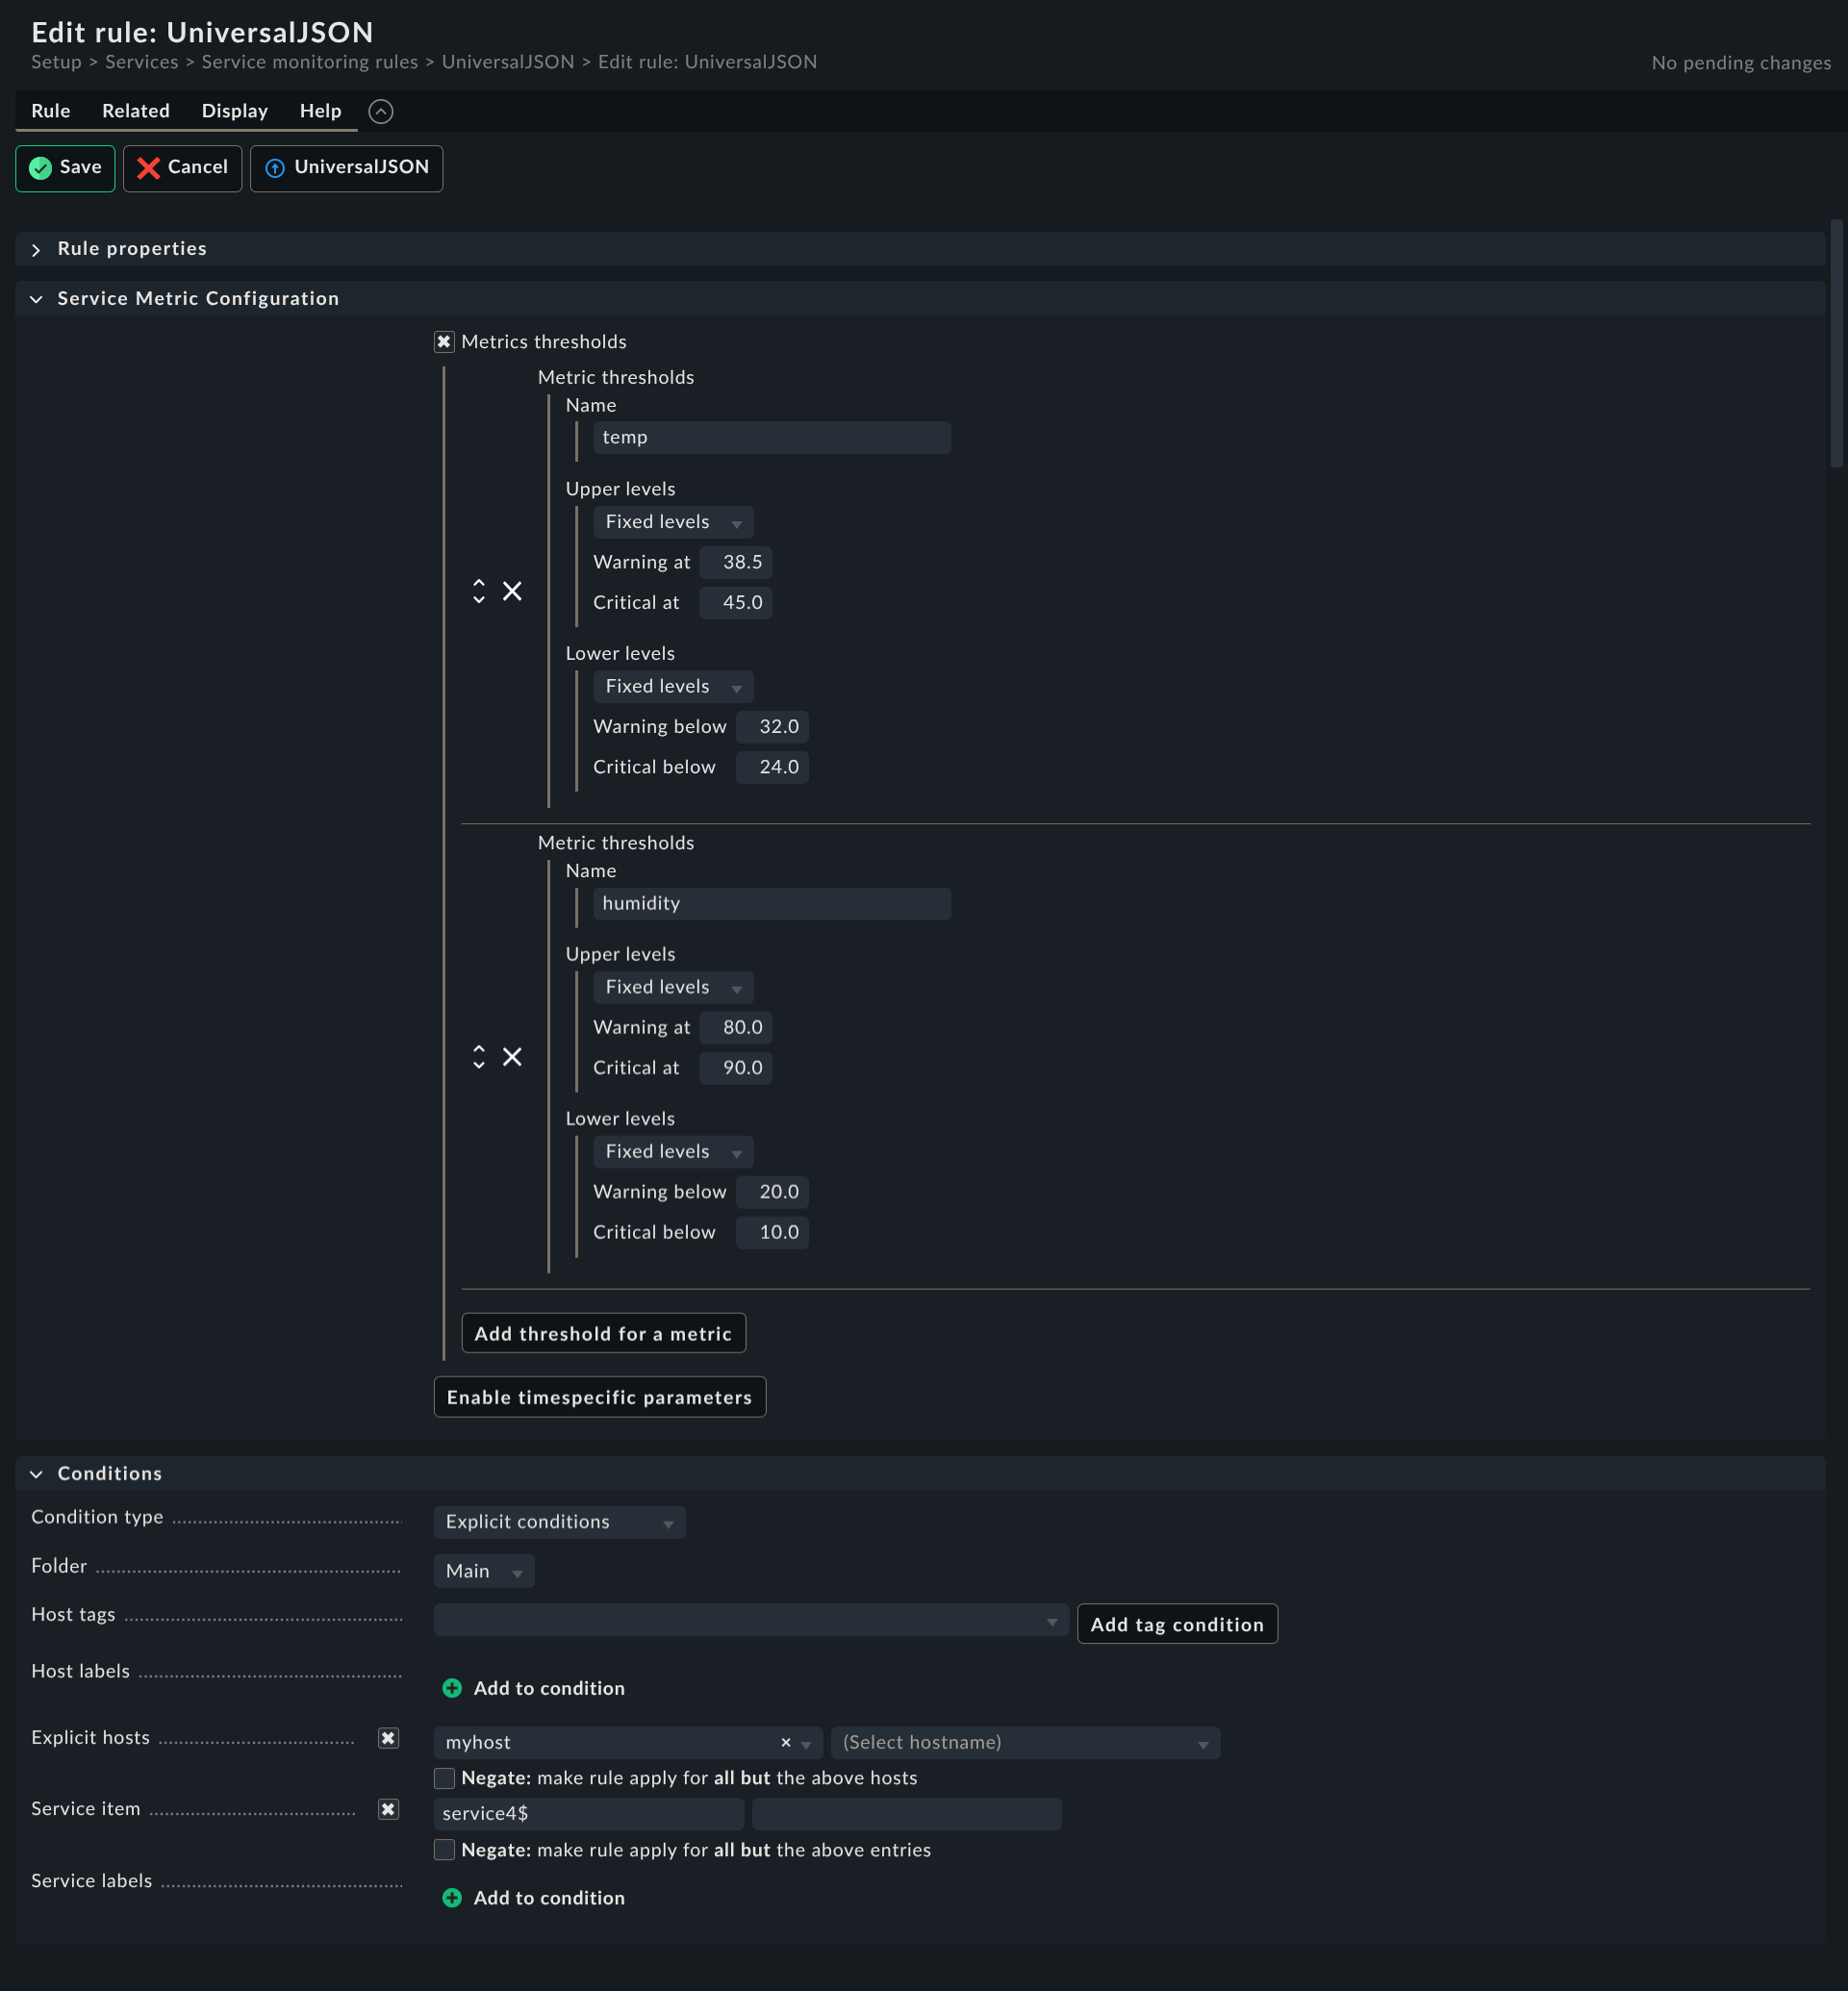
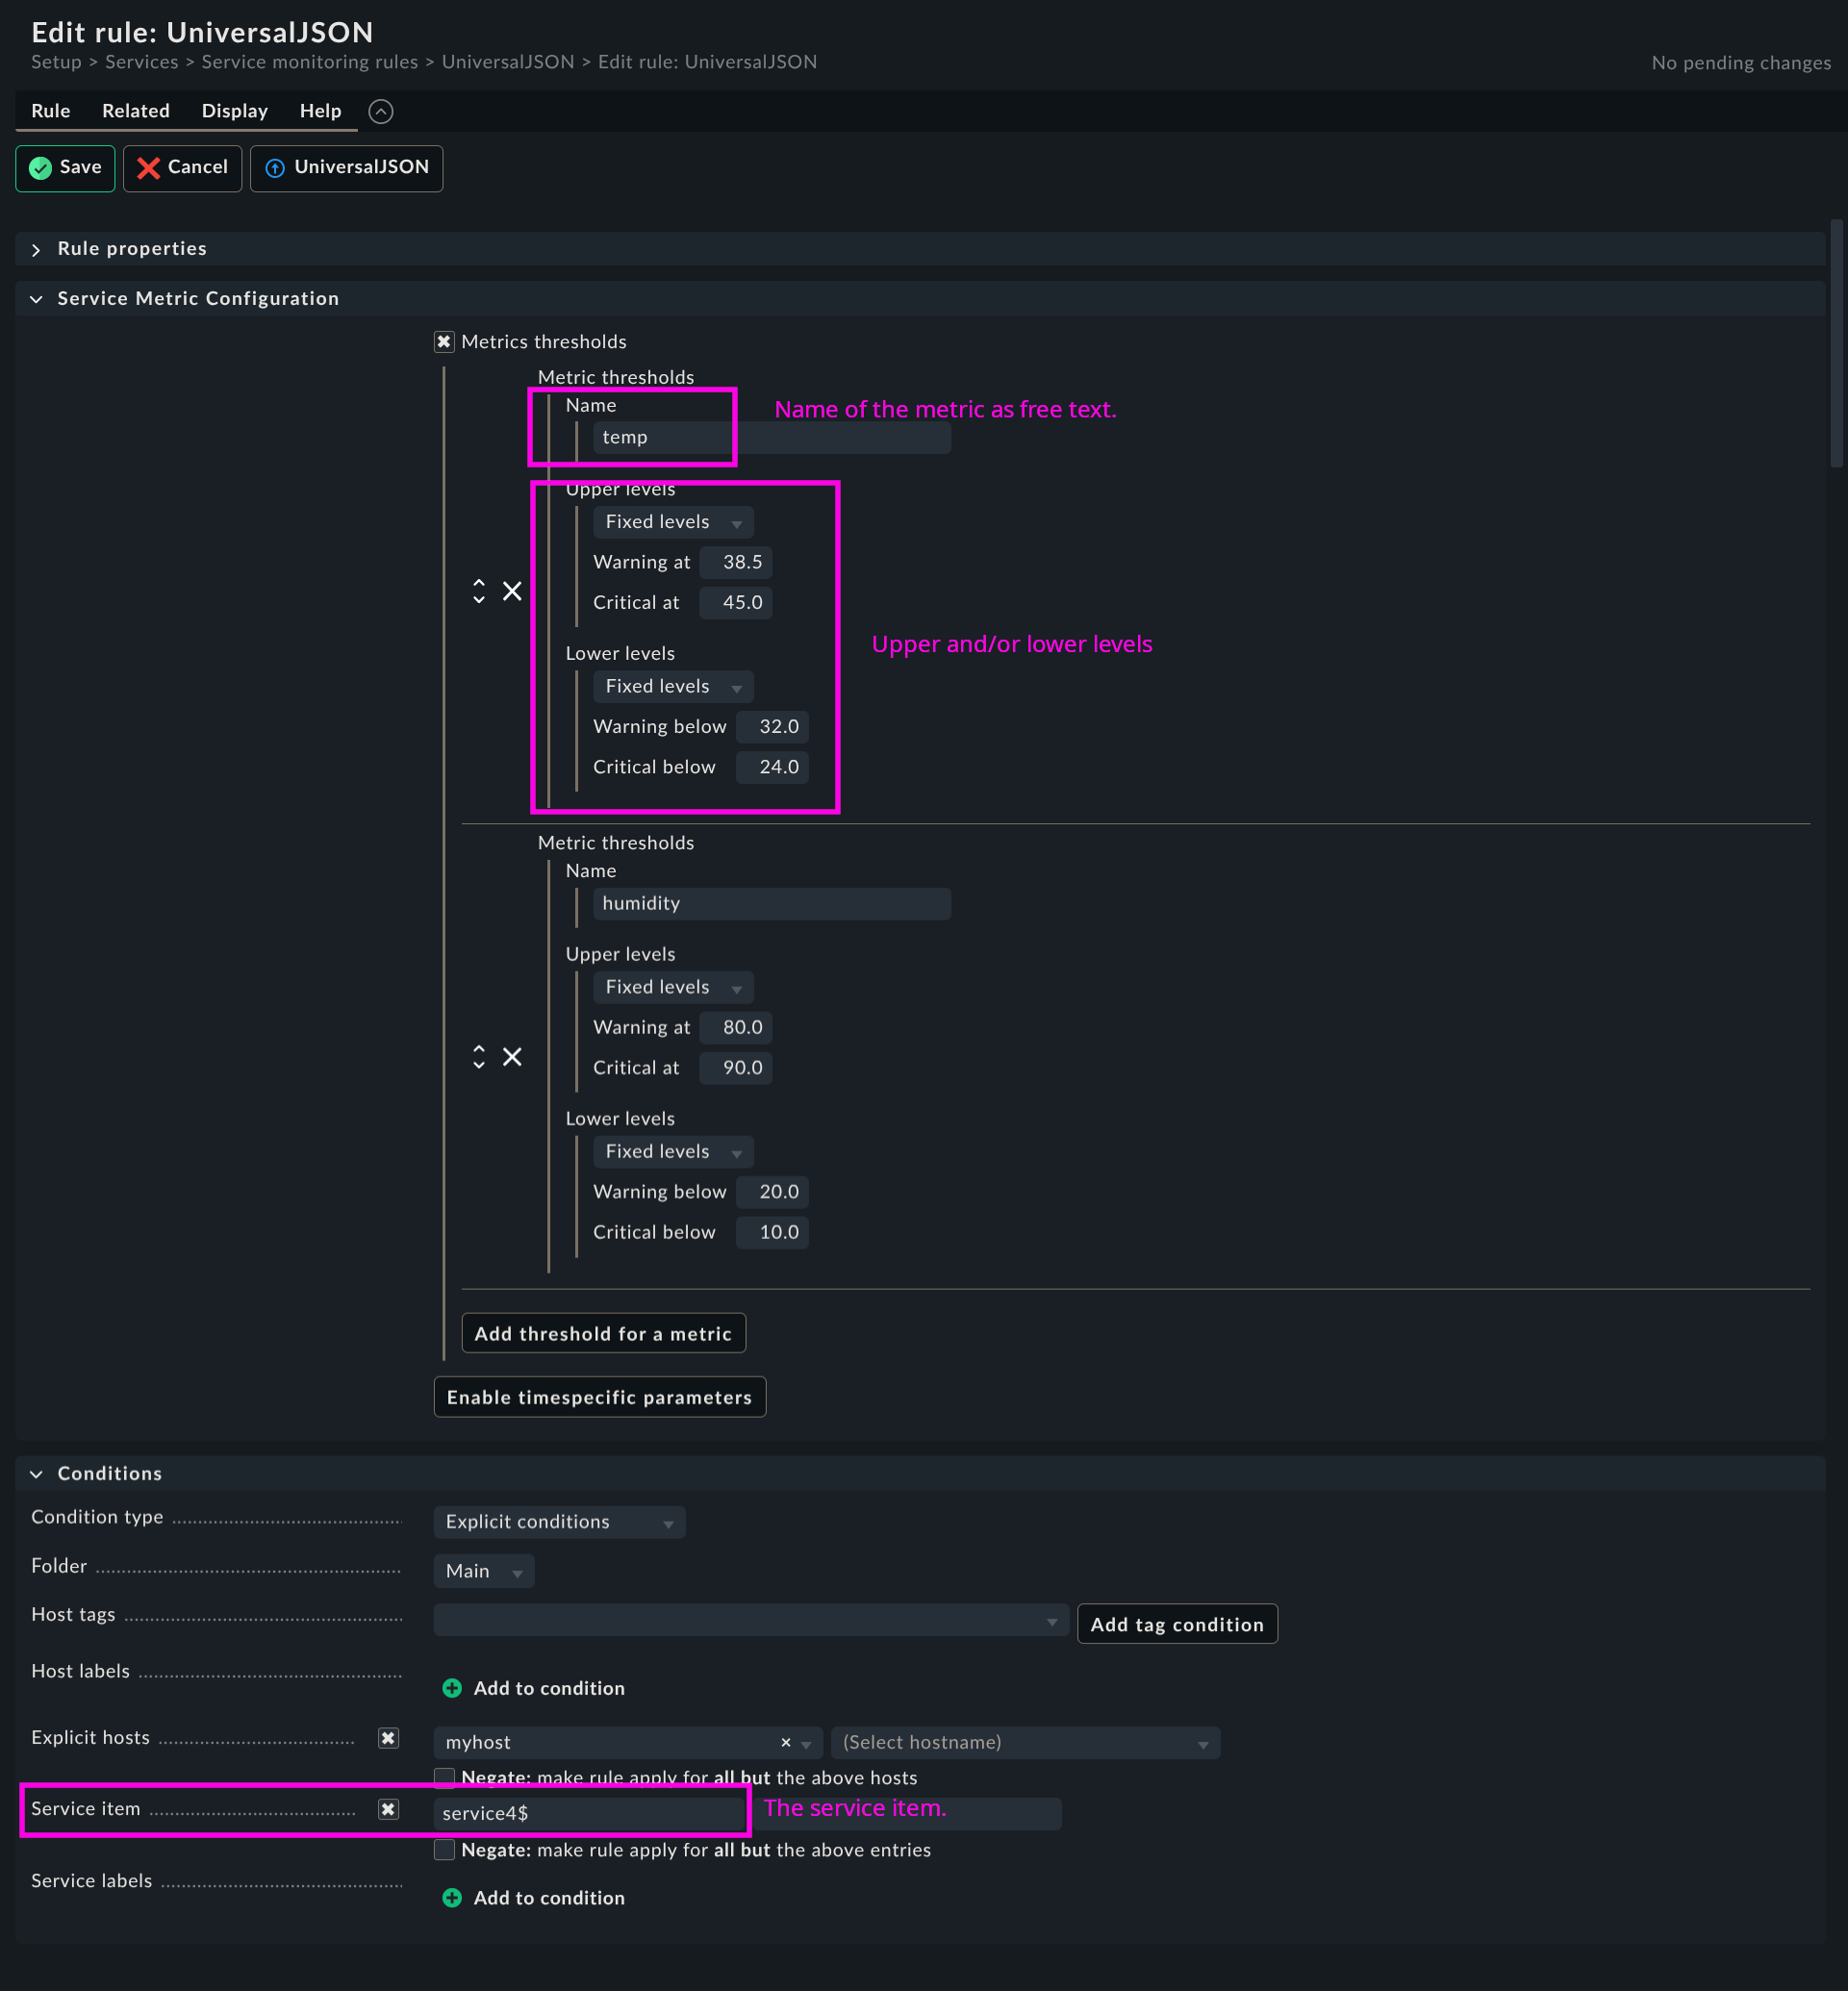
Ruleset
Full page, annotated…
Demo agent output for testing:
Demo agent plugin config-generations-per-second.py
TODO
-
introduce a timestamp field to the JSON data and allow to warn if
JSON data is outdated
-
smooth the metric measurements with a "truncated mean" a.k.a.
"trimmed mean"" (from the recent 5 past measurements drop the
highest and the lowest and average the remaining 3) to avoid false
alerts.
-
add type hints to Python code
-
An "universal http(s) agent data fetcher" is in the pipe and will
play well together with this check