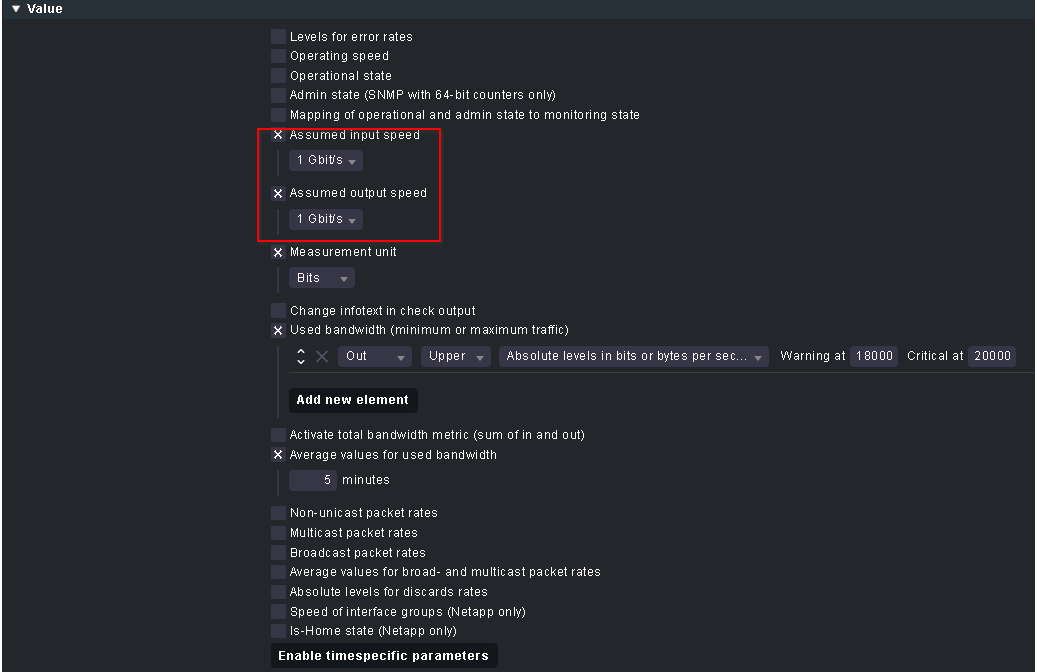
On a Checkmk CRE 2.0.0p34 I was asked a few months ago to add a check for a specific interface, which checks the outgoing bandwidth - averaged over 5 mins - to not surpass 180MB/s resp. 200MB/s (that is supposed to be Megabytes).
Since it’s not really visible on the screenshot, here are the numbers
I used for WARN/CRIT (the dots have been added to make this
more legible): WARN: 180.000.000 CRIT: 200.000.000
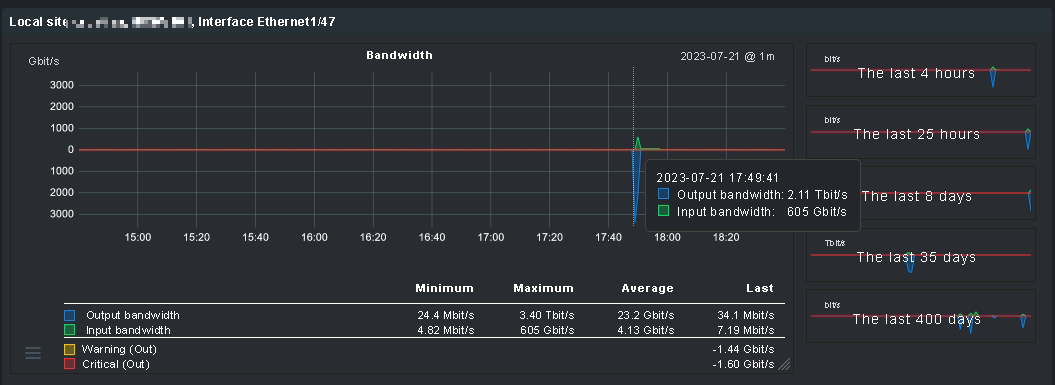
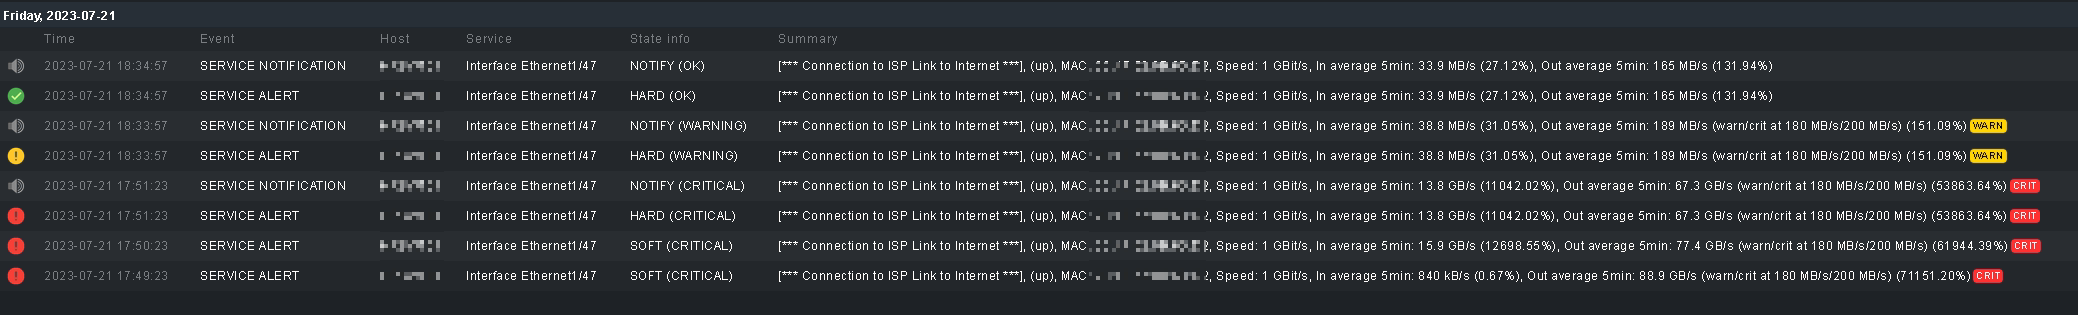
A few minutes ago, I was on the phone with people who monitor
this, and they told me that they see this, and an alert is firing:
First of all, have I added the rule correctly?
And if yes: How are those numbers (In average 13.8 GB/s and out average 67.3 GB/s) possible on a 1GBit interface? Is this “my” mistake?
Be advised, that while this alert was “witnessed” I was also “bulk renaming” ten
hosts on this Checkmk site, which almost took an hour to finish. While this may or may not have something to do with it, I just wanted to mention it, in case it does play a role.
The calculation is based on the data retrieved from the device using SNMP requests. What SNMP counters show, depends very much on the device and SNMP implementation.
I guess there might be different reasons for the behavior you have described. Please check this out:
and especially the last section
Another theoretical cause for inaccurate bandwidth measurements is that the counter has reached its maximum and wrapped. ifInOctets and ifOutOctets are 32 bit counters, meaning the highest number they can hold is 4294967295. After that number is reached, the counter wraps to zero, which means your delta between polls at the time of the wrap will produce an enormous negative number. However, the poller is designed to mitigate for this by dropping these wrapped deltas.
Some more background information about my setup: This was Checkmk 1.5, then 1.6 and finally
2.0. The rule was initially set up on 1.6, and hadn’t been changed before. This is also a “distributed”
setup, but the instances are independent of each other, it’s just configured to be able to view both
sites from one interface.
That said:
I don’t believe this is an “SNMP counter” issue. The calculation of Checkmk cannot be accurate.
There can never be over three Terabits of traffic on a one Gigabit interface: This is impossible.
Then again, there can also never be 180 MByte or 200 MByte per second on such an
interface, which would max go up to 125 MByte per second, so my rule is wrong to
begin with.
I saw that I can set the “measurement unit” on the rule to be “bits” instead of “bytes”, and now
at least the threshold is correct:
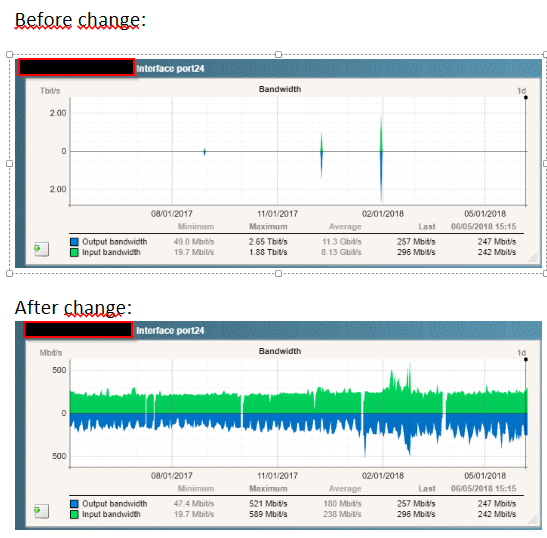
Thomas, I do not exactly the root cause of the spikes but I can share a workaround with you that I used to get rid of spikes in RRD graphs I occasionally was having in the past.
SITE = your site that is having the graphs
HOSTNAME = the affected host
Interface_port24 is the interface that is affected and having spikes:
omd su SITE
cd var/pnp4nagios/perfdata/HOSTNAME
cp -a Interface_port24_out.rrd Interface_port24_in.rrd /tmp/
cd /tmp
rrdtool dump  Interface_port24_in.rrd > Interface_port24_in.rrd.xml
rrdtool dump  Interface_port24_out.rrd > Interface_port24_out.rrd.xml
vim Interface_port24_in.rrd.xml Interface_port24_out.rrd
Search for +11 and replace all occurances by 06
Search for +10 and replace all occurances by 06
Search for +09 and replace all occurances by 06
:%s/+11/06/
:%s/+10/06/
:%s/+09/06/
Save files
Or much faster:
sed -i ‘s/+11/06/ ; s/+10/06/ ; s/+09/06/’ Interface_port24_out.rrd.xml Interface_port24_in.rrd.xml
While this is indeed a nice workaround, it somewhat defeats the purpose of
monitoring, doesn’t it? I mean if you can’t rely on the numbers you’re getting, and need to
“massage” them to “fit”, then something… is definitely off.
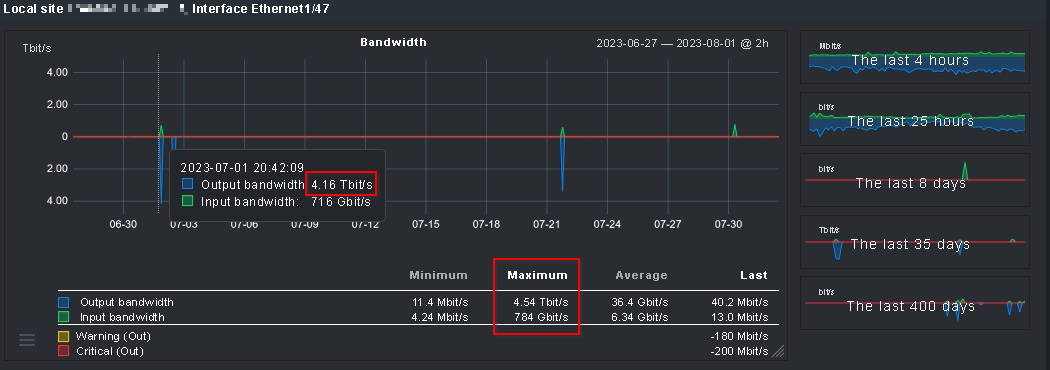
Changing the “measurement unit” had no effect. I had the same issue today: Checkmk “saw” on Interface 1/47 - a one Gigabit interface - outgoing traffic of over 3.4 Terabit (!). This is impossible:
First of all a clarification, in case this isn’t clear: This is a RAW edition.
I’m not sure what you mean with “Periodic service checks”. I only
know of “Periodic service discovery” and this rule is configured
as it comes “out of the box” i.e. run a service discovery every two hours.
That said, the only two rules that apply to the switch(es) in question, are those:
As previously mentioned, initially the rule was neither explicitly specifying the “Measurement Unit” nor the “Assumed Input/Output speed”: This was
configured later.
For the time being, the issue has not re-occurred.
Yeah, that was the one I was reffering to “Periodic service discovery” in my environment we have had issues with impossible bandwidth on most/all switches, but after I turned “Periodic service discovery” off I haven’t seen any impossible bandwidth.
Maybe there are some other configurations that might be messing with the checks, but this is atleast what I have found so far.
No, for me it’s “totally random”. The first time this happened I was “bulk renaming”
ten hosts, so I thought that this might be related. Turns out it wasn’t because the
second time, nothing like this was happening.
I have found a solution for my environment and in my case it was not enough cpu power.
Overall the machine was not going over 40% cpu usage, that number was visible in our vmware esxi environment, but if I looked at the machine itself and used htop( task manager for linux systems) I could see that at the same time the spikes were happening, all the cpu cores were at 100% for 1-2 seconds.
I tested my theory with increasing cpu cores from 6 to 8 and I have not seen any spikes for the last day.
Thanks for sharing that information. As I said, the first time this happened, I was bulk-renaming
about ten hosts, and this took almost an hour to finish. I did not specifically check the
performance of the Checkmk host, while this operation was running, but I assume that it
did have an impact on it.
The second time this happened, no such operation was taking place.
Since I’ve modified my rule as specified earlier in this thread, the issue has not re-occurred.
Additionally, I’ve also installed the modified interfaces.py@jodok.glabasna had provided,
so if it occurs again, I’ll share the relevant files with him for further investigation.
No, that was not the case. I’ve explicitly described what I was doing, while it occurred the first time:
I was bulk renaming multiple hosts.
As I’ve said in my previous comment, I assume that the Checkmk host did have elevated resource consumption, while this was running, so this may indeed have been the reason for this “spike”.
Anyway, I want to thank you once more for all the effort you put in.
Since there hasn’t come out anything specific for this issue, I’d say that it
is likely that it happened due to elevated load of the Checkmk host, and/or
I was receiving “wrong” values.
This topic was automatically closed 365 days after the last reply. New replies are no longer allowed. Contact an admin if you think this should be re-opened.