Using CheckMK rest-api extract metrics

Hi,

I am following this documentation: Checkmk REST-API

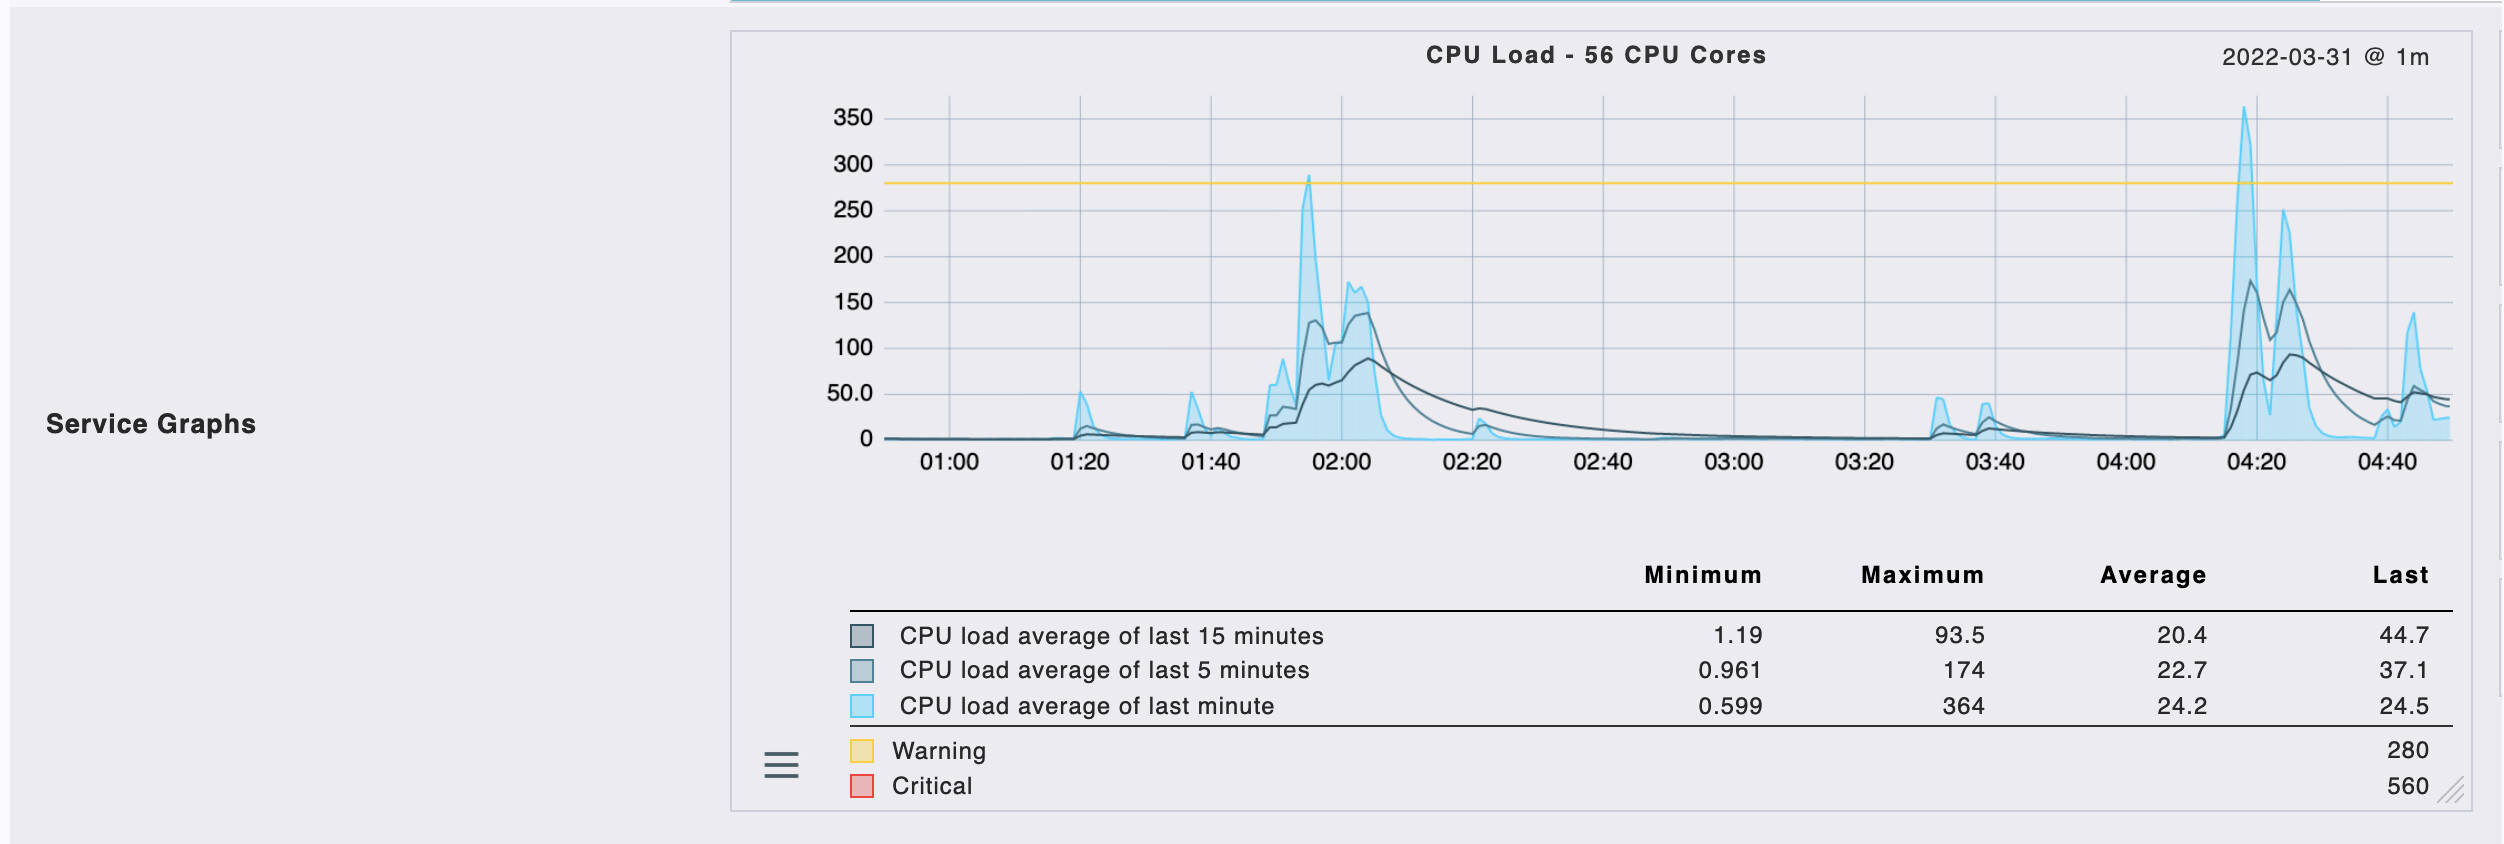
I am trying to extract metrics (e.g CPU load info) from a host, a snippet of my code is

#!/usr/bin/env python3
import pprint
import requests

HOST_NAME = "hostsite"
SITE_NAME = "sitname"
API_URL = f"http://{HOST_NAME}/{SITE_NAME}/check_mk/api/1.0"

USERNAME = "user"
PASSWORD = "password"

session = requests.session()
session.headers['Authorization'] = f"Bearer {USERNAME} {PASSWORD}"
session.headers['Accept'] = 'application/json'


resp = session.get(
    f"{API_URL}/domain-types/service/collections/all",
    params={  # goes into query string
        "host_name": 'hostname',  # A hostname.
        "query": '{"op": "and", "expr": [{"op": "=", "left": "host_name", "right": "hostname"},{"op": "=", "left":"description", "right": "CPU load"}, {"op": "=", "left":"metrics", "right": "CPU load"}]}',
    },
)

if resp.status_code == 200:
    pprint.pprint(resp.json())
elif resp.status_code == 204:
    print("Done")
else:
    raise RuntimeError(pprint.pformat(resp.json()))

This code above is not fetching me the metrics I need for a particular service.

I thought from the “services” table, I could use for example the “metrics” function defined as:
metrics list A list of all metrics of this object that historically existed

But how do I use this in the rest-API query? So I could extract actual values from the services I want, like CPU load, CPU utilization, etc. Thank you!

Best,
Jem

Fetching the real metric data is a little bit more complex.
The livestatus query used is shown here in the KB article.
https://kb.checkmk.com/display/KB/Query+historical+metrics
Until now i don’t used such a query over the REST-API, but it should be possible to build also this query for the API.

1 Like

Hi @andreas-doehler ,

I looked at the link you mentioned, so for example

`curl -k ` `"https://klappanas/daily/check_mk/webapi.py?action=get_graph&_username=automation&_secret=ROQAKYYIDYDOELRRLVVH&request_format=python&output_format=python"` `-d ` `'request={"specification":["forecast","forecast_graph_4"],"data_range":{"time_range":[1616062956,1616513102]}}'`

The things I would have to change for my case would be,

  1. The link, the right hand side is the hostname and sitename I am using
https://klappanas/daily/check_mk/webapi.py? = https://um-omd.aglt2.org/atlas/check_mk/webapi.py?
  1. For the automation and secret, where do I get that info? As i only have a username and password.

  2. For this request part:

request={"specification":["forecast","forecast_graph_4"]

I am not sure where to find the forecast graphs in my host, is it the same as service graph? I assume forecast_graph_4 is the name of the graph correct?

Just to give you an idea, this is what I see on my end, for example I want to grab this data:

Hi Andreas,

I tried the WEB-API version here check below

[guhitj@cdragon] curl -k "https://um-omd.aglt2.org/atlas/check_mk/webapi.py?action=get_graph&_username=<user>&_secret=<automationsecret>&request_format=python&output_format=python" -d 'request={"specification":["template",{"service_description":"Memory /","site":"atlas","graph_index":0,"host_name":"umfs06"}],"data_range":{"time_range":[1648711842, 1648715442]}}'

And this is what I get.

{'result_code': 1, 'result': 'Checkmk exception: Cannot calculate graph recipes: No matching entries found for query: GET services\nColumns: perf_data metrics check_command\nFilter: host_name = umfs06\nFilter: service_description = Memory /\n'}

Any advice on how to fix this? I could get this working with LiveStatus and I am trying to do the same for the WEB-API version.

Best,
Jem

Forcastgraphs are only available inside Enterprise edition. Why not starting with a normal graph like in the KB?

lq "GET services\nFilter: host_name = localhost2\nFilter: service_description = Filesystem /\nColumns: host_name\nColumns: service_description\nColumns: rrddata:m1:fs_used.max,1024,/:1614839543:1614929543:30\nOutputFormat: python"

Here you must pay attention as the timestamp must be calculated by your script. The two are start and end of the requested timeperiod.

1 Like

Hi Andreas,

The live status works for me:

OMD[atlas]:~$ lq "GET services
Filter: host_name = umfs06
Filter: service_description = CPU load 
Columns: rrddata:m1:load1.max,1,*:1648711842:1648715442:1
OutputFormat: json"
[[[1648711800,1648715460,60,46.572,44.7538,17.1832,6.96517,2.992,1.254,0.985667,39.596,40.1385,15.4943,6.64633,3.43367,2.276,1.71017,1.67567,1.664,1.72817,1.908,2.025,1.80133,1.57033,1.78967,1.674,1.22867,1.08533,1.366,1.37433,1.44833,1.56,1.62933,1.63533,1.48433,1.48633,1.429,1.619,1.38533,1.2325,2.33833,2.33133,1.70933,1.67483,1.592,1.352,2.4995,5.57633,115.463,261.571,363.886,322.207,167.702,65.1247,27.3383,133.288,251.52,225.567,143.077,93.307,35.2182,15.731,7.755,4.608]]]

As you could see here. But I’m hoping to script this as part of a network benchmark program I am working on. I usually use the request/curl module, so I was hoping to do the same for this. Do you think I should just go this route instead of trying the WEB-API syntax?

In WATO → Users you need to cerate a user with automation secret:

And give him the necessary permissions.

I hope that helps.

regards

Michael

Hi @mike1098,

Thank you that helps alot! I setup the automation secret. Now I just have to find the correct syntax to be able to use the curl command for the WEB-API, check my current code snippet above. Its not fully working when I use the curl for the WEB-API but it works when I use livestatus. Thanks!

This topic was automatically closed 365 days after the last reply. New replies are no longer allowed. Contact an admin if you think this should be re-opened.