Sometimes you want status data (Host Up/Down, Service OK/Warn/Crit) from CMK in your Grafana dashboards, but as of now CMK does not provide this data with its Grafana plugin.
But there is a workaround.
You need an automation user as described in Users, roles and permissions - Authorization and user configuration and the Grafana CSV datasource plugin CSV plugin for Grafana | Grafana Labs
After installing the Grafana plugin, create a new CSV Datasource in Grafana.
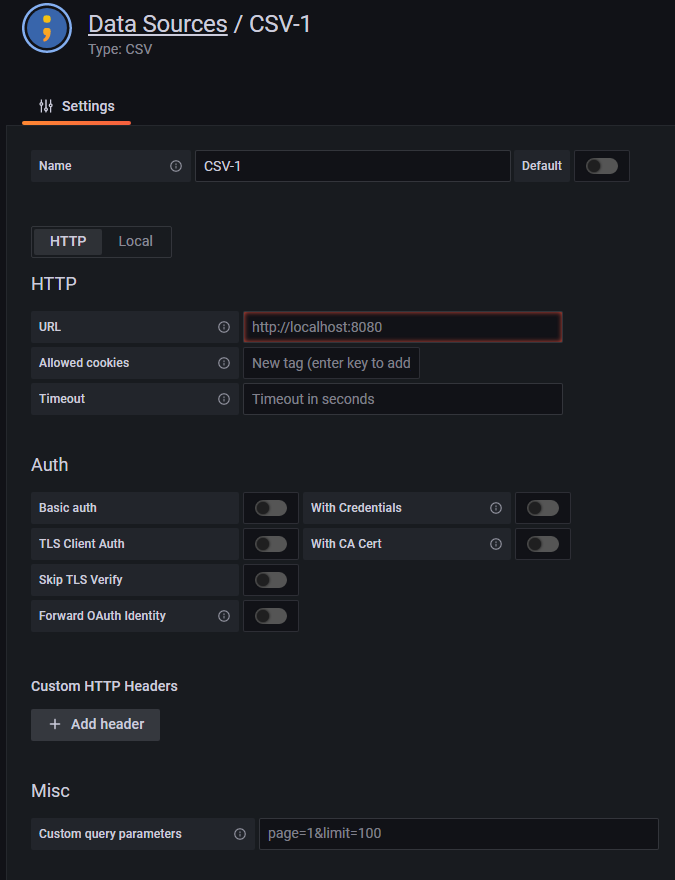
For “URL” use the URL to your CMK instance’s view.py. For example https://mycmkserver.com/myinstance/check_mk/view.py
For “Custom query parameters” insert output_format=csv&_username=myautomationuser&_secret=mysecret&view_name=allhosts
replaceing _username and _secret values with your automation user’s credentials.
This would return status data for “all hosts”. You can change the view_name to any CMK view or you can omit it here and configure it inside the Grafana panel.
Save the datasource and start by creating/editing a dashboard and adding a panel.
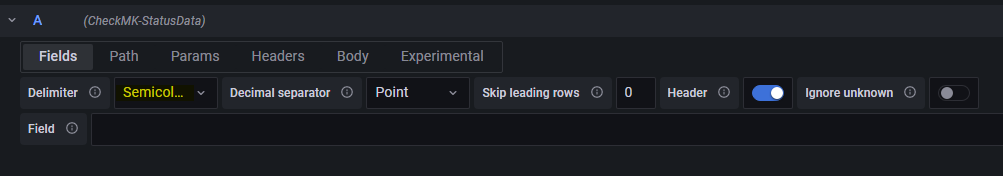
Inside the Grafana panel choose the CSV Datasource you created previously and set the “Delimiter” to “Semicolon”!
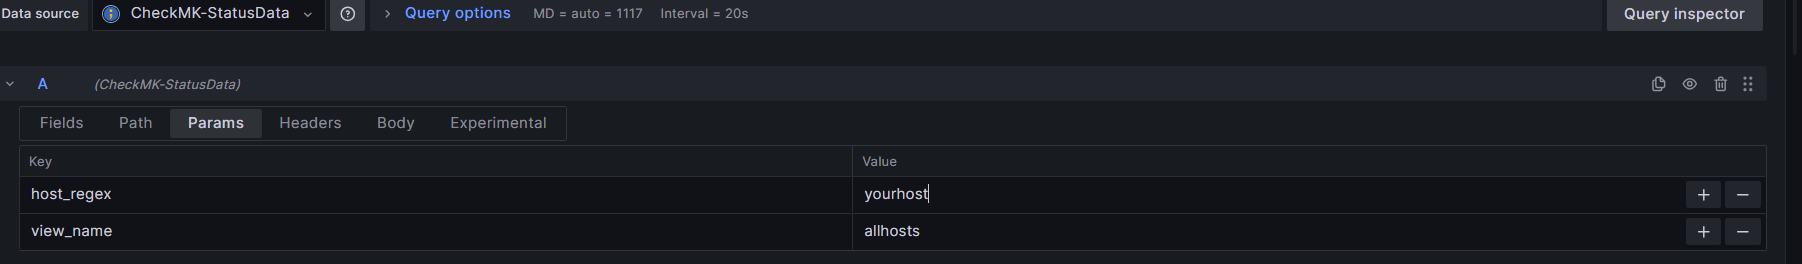
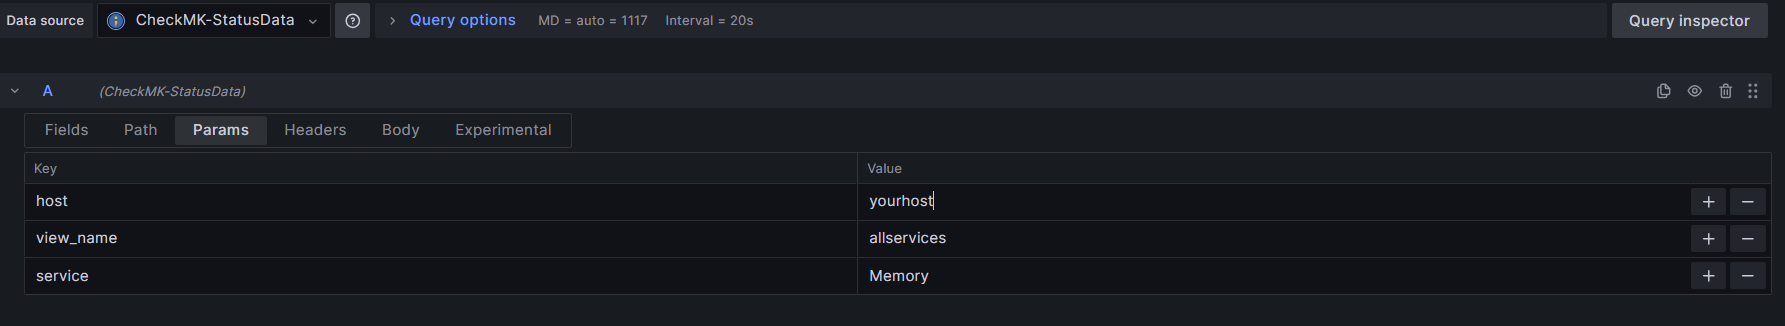
If you omitted the view_name in the datasource you can add it in “Params” here.
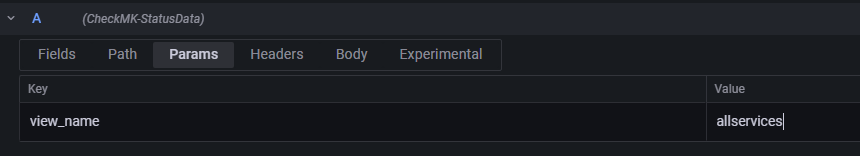
You can add other CMK URL parameters, like hostgroups etc. here as Key/Value pairs.
Note: As status data does not have timestamps, you can mostly just use the “Table” visualization for displaying the data.