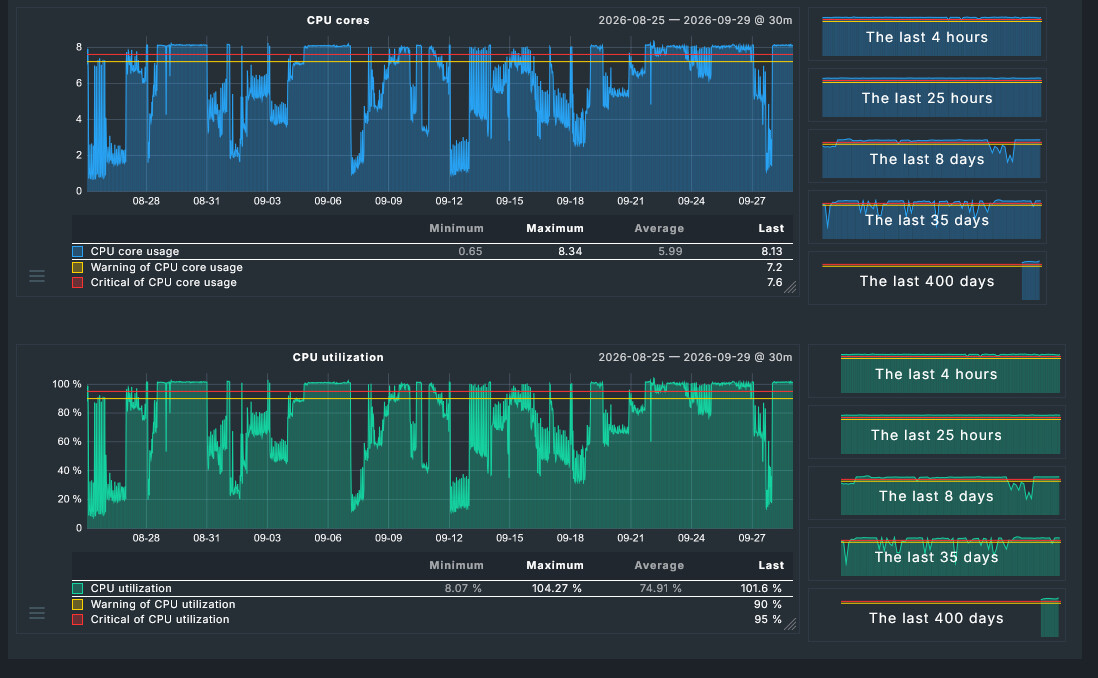
As no changes were made in between a/the upgrades (services are quite static) i am curious as to how i can determine where this unexpected load-increase is coming from.
What can be seen/comes to mind is when i ( non-connected, but monitored sites) are 2 test-instances ( same version) seem to influence usage greatly as to the monitored services on them.
Thing is the CMK-server itself also sees this ‘peak’, and starts to alert on itself:
If i look at the Proxmox-VE usage ( on proxmox UI itself) i also see it spiking constantly, which is then ofc picked up by the monitoring-server.
Again, main concern from my end is that this is seen since the upgrade to the 2.5.0Px -branch, and i do understand with new features an increase in cpu-use can be experienced.
But with 8 cpu’s assigned this which i am seeing is just way over the top of what can/should be expected as an increase between major version-upgrades.
Also due to the monitoring i constantly now have the CMK-server going to status ‘crit’ just because of this, and am receiving notifications on its status.
There are two points i would inspect in such a system.
Comes the high load from Apache or from the Nagios core.
If it is the Apache i don’t know what is possible to reduce the load.
For the Nagios core i would recommend the setting max_concurrent_checks to be set to a value of 12 or maximum 16 in your case. The setting is inside the timing.cfg Nagios config file.
I had some RAW systems where the core was thinking to execute all active checks (CheckMK service, HW/SW Inventory + Discovery) all together after the update and i got the same behaviour as your system.
Good pointer, thank you for that.
I’ve not had to fiddle around in timing.cfg before, but for good measure i’ve set the max concurrent checks parameter ( was set to 0) to 16 for now.
If it calms the machine a bit down the i’m happy again.
has done its job, i have since then not seen a single notification of the CMK-server spiking on resources in use.
I think your assumption in CMK trying to fire all active checks at the same time was right (as you spoke out of experience).
So again a very good call in helping me solve this.
Glowsome
ps,
Trying to find the ‘resolved’ option to click, but i seem to no longer have it ? … or i’m looking in the wrong place. @Sara did something change on the forum, as i was well aware of this option previously ?
.. or am i just being daft