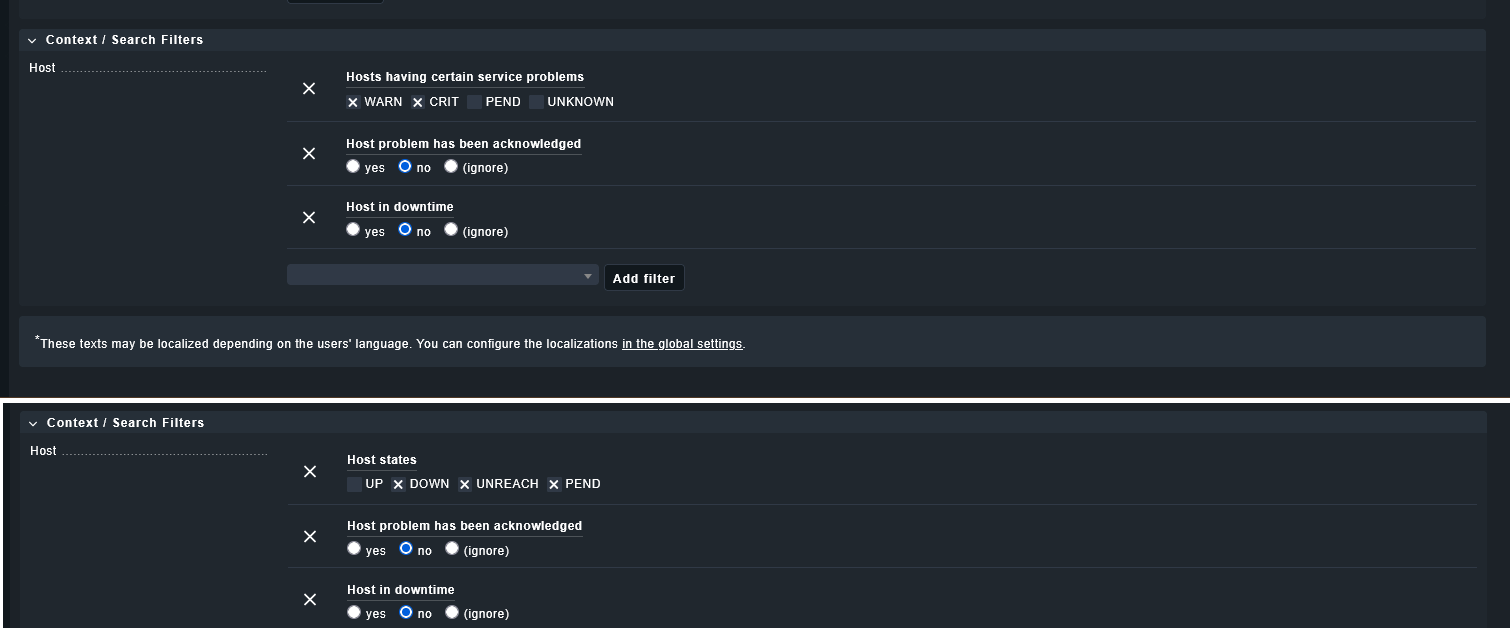
I have a custom dashboard with 2 views, where i just want to monitor Down state hosts and Services Warn&Crit, which have been not ackowleged nor in downtime.
But it still shows me a down state host, which is acknowleged and in downtime.
Are the filter conditions OR or AND ? What i am doing wrong?
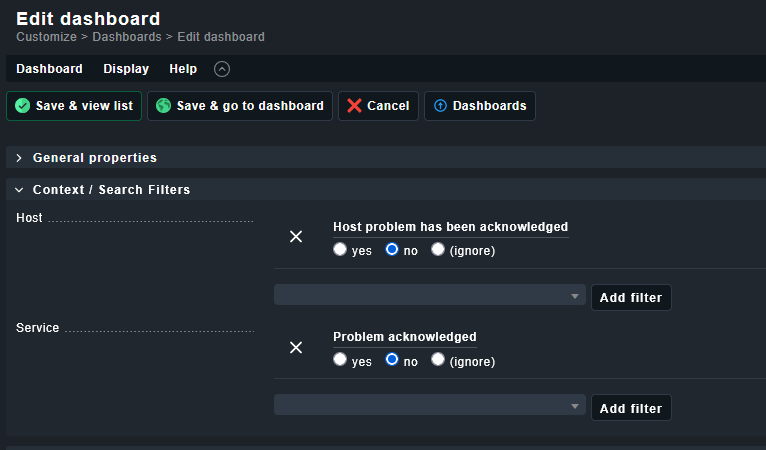
The filters are applied in the views, because if i apply those filters on my main dashboard, it would filter out other views, where i want to see acknowledged problems
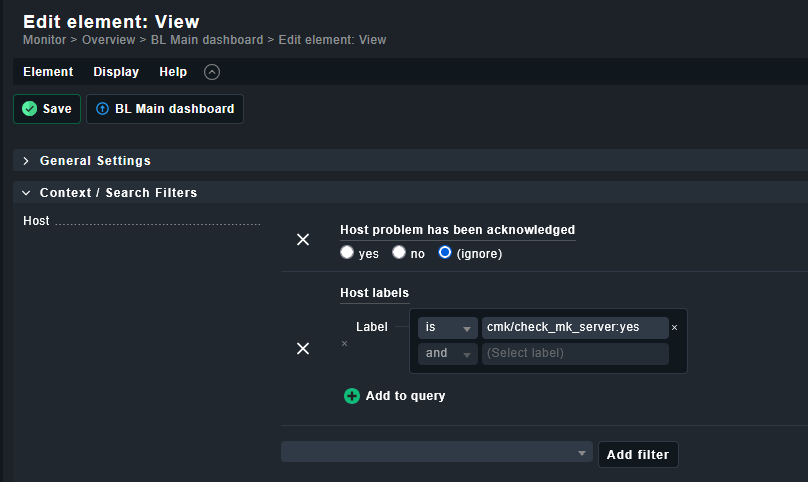
Sorry you didn`t mention that you want to add another view with acknowledged issues. Either way can can apply a filter in the dashboard and overwrite it in the view settings in the Dashboard.
and the other 2 views are still the same configured.
If my checkmk has now and critical service, it still shows up on the view on dashboard. But Hosts in down state or with critical services not disappear in the other 2 views, even if they in scheduled downstate or acknowledged.