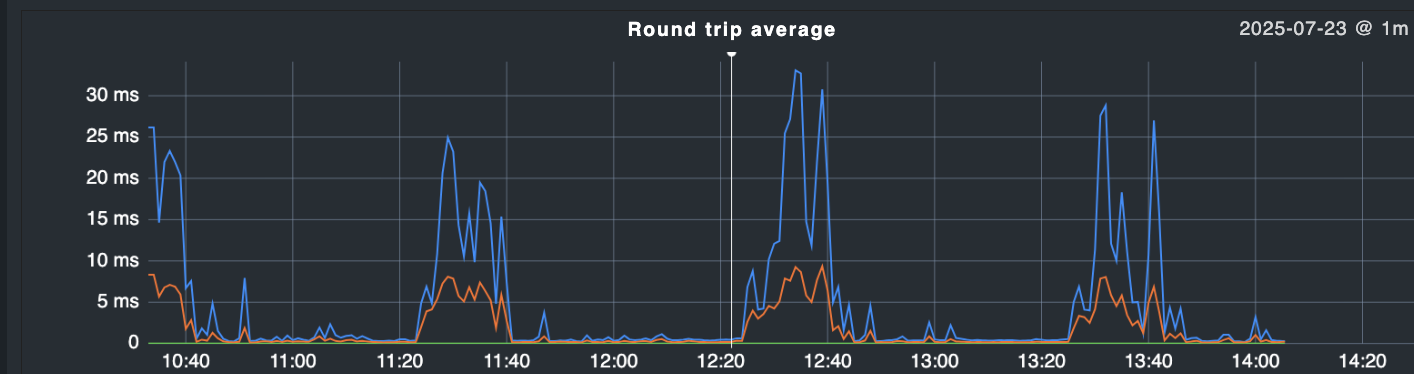
i have found that after reboot of my checkmk monitoring VM (2.4.0p8_0 RAW), i’m getting weird ping latency measurements with 1 hour intervals sometimes. these happen then to all monitored systems, regardless of vm or real hardware.
when running a ping in console in parallel to the same hosts i cannot observe any latency spikes, so it seems there is something special in checkmk ping which makes these spikes happen.
what could be the reason for that and how can i fixe these apparently wrong measurements ?
i have made a tcpdump in parallel (to normal checkmk monitoring without my ping being active in console) and it seems those spikes are not visible there (have cut time information below 0.001s for better readability, see latencies.txt)
what’s going on ?
what can cause such spikes being observed which apparently are not existant ?
there is no switch, firewall or router in between, the nexus vm is on the same host like the montoring vm.
I was expecting this the problem here is the overload of your Nagios core with checks. I don’t mean that your device is too small or something like this. In the default configuration the Core tries to execute all checks that it gets at the same time. This will not work and this leads to an jam in the execution of checks. The ping host check is for Nagios the same as any other active check.
What can lead to the one hour interval is the check interval of some of your checks. Like the automatic discovery.
I would recommend to adjust the setting for maximum concurrent checks inside the Nagios core config to not more than two times the number of cores you have in your system.
the problem here is the overload of your Nagios core with checks
where can i “see” that nagios core is overloaded ?
i found /opt/omd/sites/mysite/etc/nagios/nagios.d/timing.cfg and adjusted max_concurrent_checks to 2x$numcpu
but i don’t really understand why parallel task exectution can have such influence on ping latency, especially when cpu usage graph or number of thread graph is totally flat and has no spikes.
if local peaks of parallel taks would impact icmp response time, i would expect to see that in console ping, too.
i have 79 hosts and 2217 services. the large number of services comes just from the “default” when adding a host via agent to the system. i can reduce that number but i read that other people had far more hosts and services with raw edition.
the question is, what’s causing it, as the system runs fine for quite a while and without any change in configuration - but after a while it suddenly get’s high cpu load which apparently also causing the latency spikes, as we can see a clear correlation here.
let’s see if things behave better now with limiting the checks via nagios timing.cfg file.
I try a quick explanation. The check_ping or check_icmp are normal active checks that are executed as every other active check.
If you use check_ping then the command sent’s one ICMP package every second until it reaches 5 sent. The command measure the time every ICMP package needs to come back. Now we have the problem that your CPU is overloaded as you see in your load graph. That means that processes have to wait for CPU time to process the data they want. That will also affect system processes that process the network traffic and so on. That means high CPU load leads to high ping times.
This is not a complete description of the problem more like a try of simple explanation
The parallel running processed don’t need to consume a high amount of MHz from the CPU. Most times load is more important than raw CPU usage.
I would test this more with execution check_icmp or check_ping manually at the time of high ping.
A normal ping cannot directly compared with the active checks.
Number of services are not responsible for your problem. Only the number of active checks and the number of hosts are a relevant number.
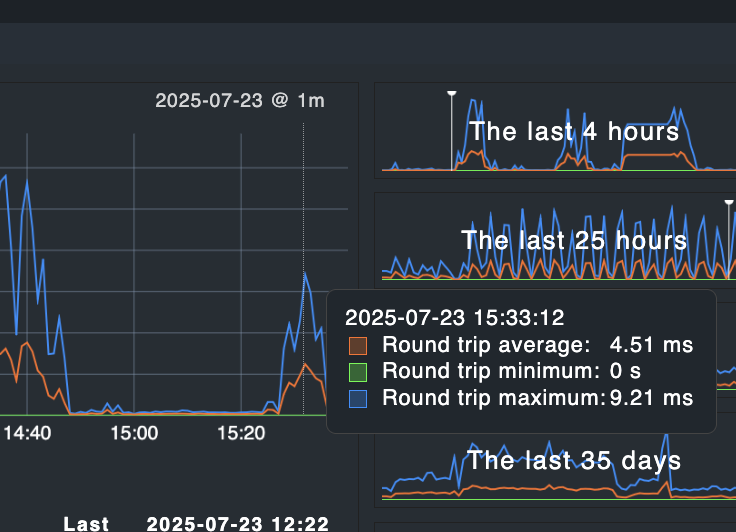
That is not so easy to say. In the graph in your first post you see in the 35 days graph that ping times where also high until around a weak ago.
I would first check if the discovery and HW/SW inventory checks are configured to run only every X hours. As booth are very CPU heavy active checks. Also i would inspect the runtime of the “Check_MK” services. Here you can improve the agent config to get better runtime or you can improve the SNMP section config for SNMP devices with high runtime.