I am still unable to reproduce such spikes in my lab.
Even not with turning on and off the periodic service discovery.
But I now extended the checkmk interface check lib/python3/cmk/base/plugins/agent_based/utils/interfaces.py to log what it got as raw data and what it calculated out of that.
Please send me a private message if you are interested to uses this to debug your interface spike phenomenas.
Some background:
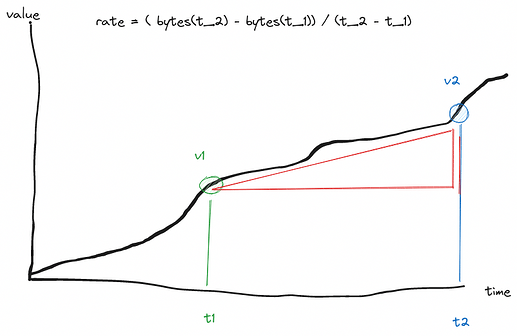
The bandwidth rate is calculated using the previous value, and it’s timestamp from the value store.
The modified interfaces.py will create a folder structure interface_logs/yyy/mm/dd//<interface_fs_save>.log and log a json line one each check intervall
OMD[central]:~$ tail -n1 interface_logs/2023/08/16/myhost.mycompany.tld/tun0.log | jq ''
{
  "timestamp": 1692195397.2286897,
  "host_name": "myhost.mycompany.tld",
  "item": "tun0",
  "in_octets": 136673920,    <--- raw rx counter data
  "out_octets": 24733351,   <--- raw tx counter data
  "value_store": {
    "outtraffic.None": [
      1692195397.2286897,
      24733351
    ],
    "intraffic.None": [
      1692195397.2286897,
      136673920
    ]
  },
  "rates_dict": {
    "intraffic": 2037.9487204080037,
    "outtraffic": 750.7709995843549
  }
}
- Storing this data helps to do a back in time analysis.
- Logs are stored in ~/interface_log/yyyy/mm/dd folders to allow you to easily remove old data from by a cronjob:
echo "0 6 * * * find ~/interface_logs/ -type f -mtime +4 -delete" > ~/etc/cron.d/custom_interface_logs
omd restart crontab
- But I suggest running this on a test site with only one or a few devices in it.
- This is a site-by-side diff of the modified interfaces.py https://github.com/t29j/checkmk/compare/2.1.0…t29j:checkmk:2.1.0-interfaces-debug?diff=split
- This is the raw file https://raw.githubusercontent.com/t29j/checkmk/2.1.0-interfaces-debug/cmk/base/plugins/agent_based/utils/interfaces.py to be copied to ~/local/lib/python3/cmk/base/plugins/agent_based/utils/interfaces.py and then a omd restart
